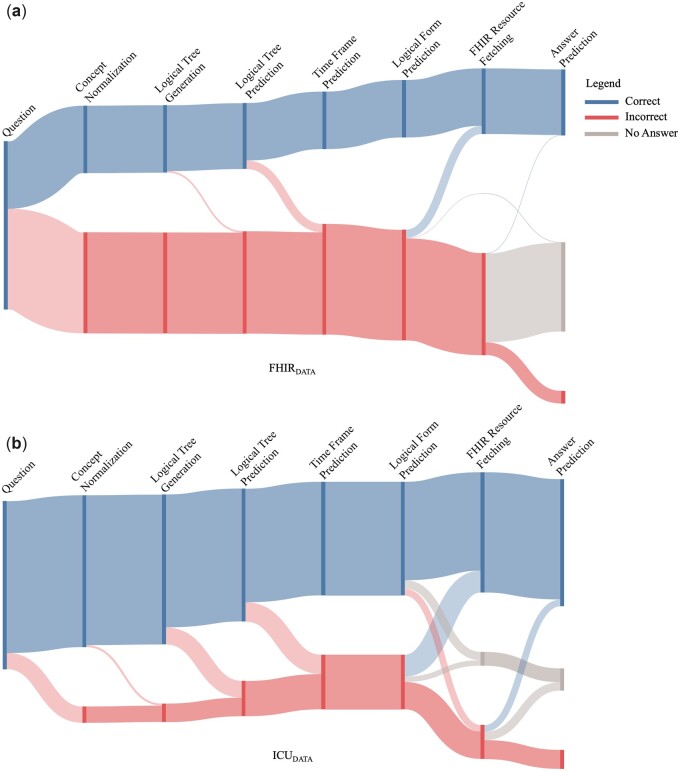
Figure 5.
The flow of errors through quEHRy for both of the datasets. The length of the bars corresponding to the different components represents a cumulative measure of correct predictions or generations (eg, at any correct bar in the graph, the proportional number of questions had correct responses for all the previous steps).

