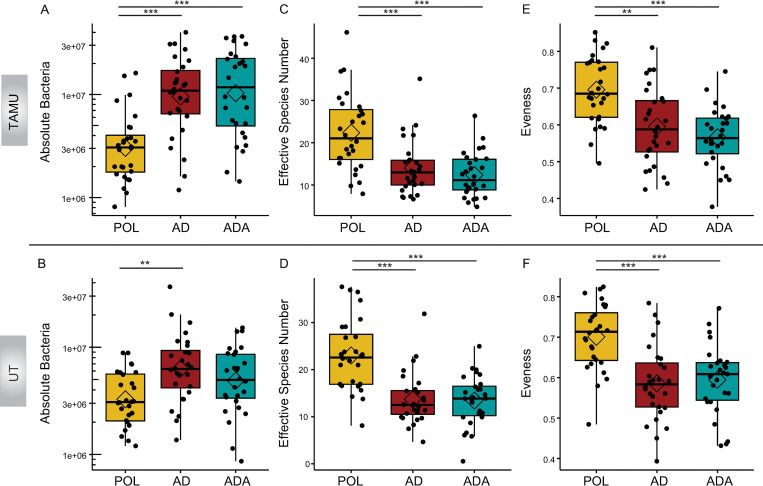
Fig 2. Dietary effects on microbiota.
Effects of bees being fed pollen (POL) versus an artificial diet (AD) or an artificial diet with additives (ADA) on the gut microbiota at 2 sites (TAMU and UT, n = 28 bees per condition per site). (A-B) Plots of the absolute abundance of total gut bacteria per 1 μL bee gut DNA. Total gut absolute abundance is the summed values of absolute abundance from all taxa in a sample. Total 16S rRNA gene copies were estimated by qPCR split by taxa relative abundance and corrected for rRNA operon number per genome. (C-D) Plots of species richness as assessed by effective species number. (E-F) Plots of species evenness as demonstrated by Pielou’s evenness index. *p < 0.05, **p < 0.01, ***p < 0.001, post hoc pairwise comparisons using Tukey and Kramer (Nemenyi) test with Tukey distribution approximation for independent samples following Kruskal-Wallis. Diamonds indicate the mean value for each boxplot in this and following figures.

