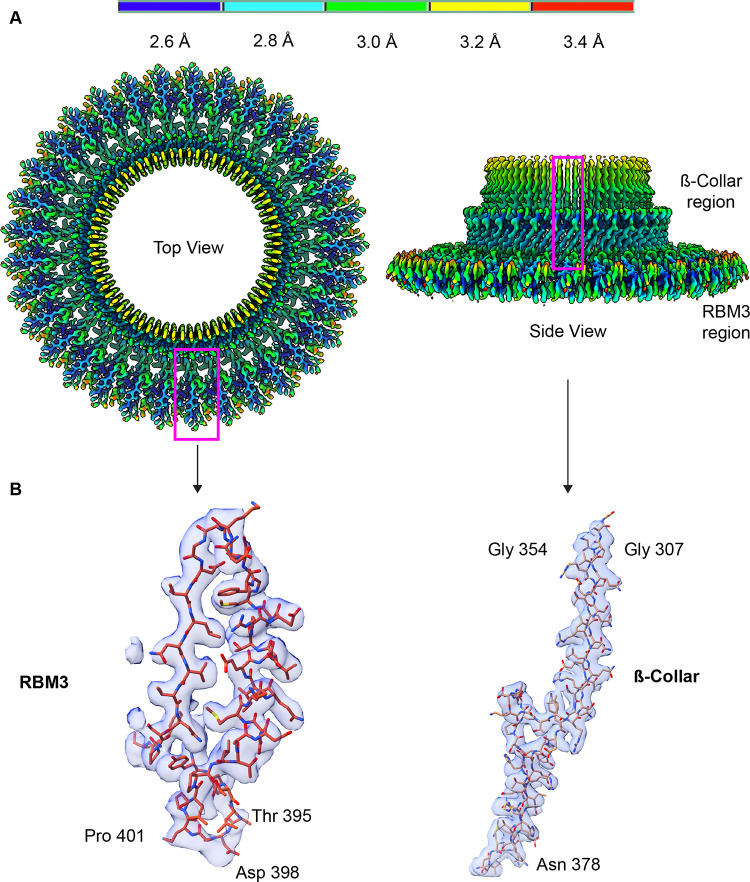
Fig 5. CryoEM structure of the soluble region of the MS-ring.
(A) Map of the C33 RBM3 colored by the local resolution, which ranges from 2.6 Å in blue to 3.4 Å in red. Regions marked with the magenta boxes are shown in panel B with corresponding density. (B) Representative fit of models into the cryoEM density map.

