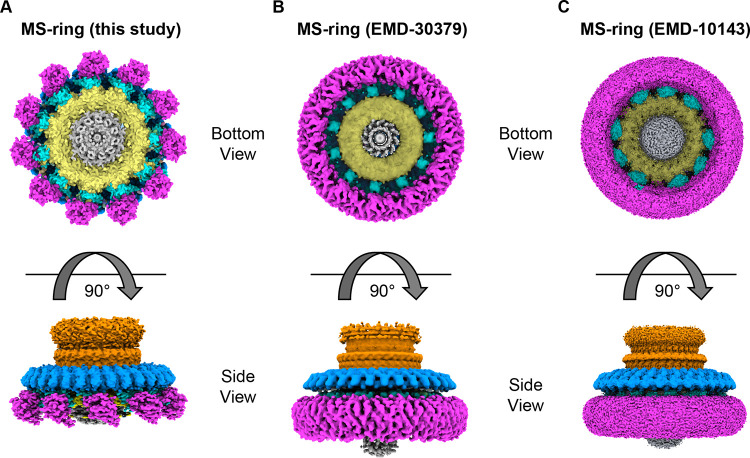
Fig 9. Comparison of available high-resolution cryoEM density maps [17,20].
In each figure panel, RBM3 is shown in blue, the β-collar is shown in orange, RBM2inner is shown in yellow, RBM2outer-RBM1 is shown in cyan, and the transmembrane domains are shown in magenta. (A) EM density map of the MS-ring reported here (B) EM map for MS-ring from EMD-30379 [20] (C) EM map for MS-ring from EMD-10143 [17].

