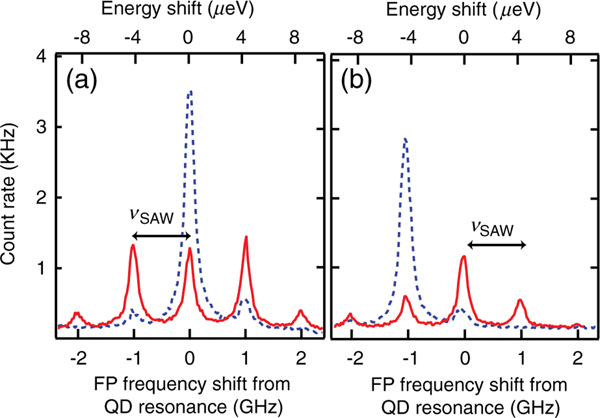
FIG. 4.
(color online). The blue dashed curves correspond to a QD vertical displacement of , and the red solid curves correspond to . The QD emission wavelength is 924 nm. Each curve corresponds to 30 seconds of data. (a) The QD is weakly driven on resonance and the spectrum of the resulting QD fluorescence is resolved with the scanning FP interferometer. (b) The QD is driven by a laser tuned 1.05 GHz below the QD resonance (red sideband). The fluorescence spectrum becomes asymmetric, with average photon energy greater than the energy of the laser photons.

