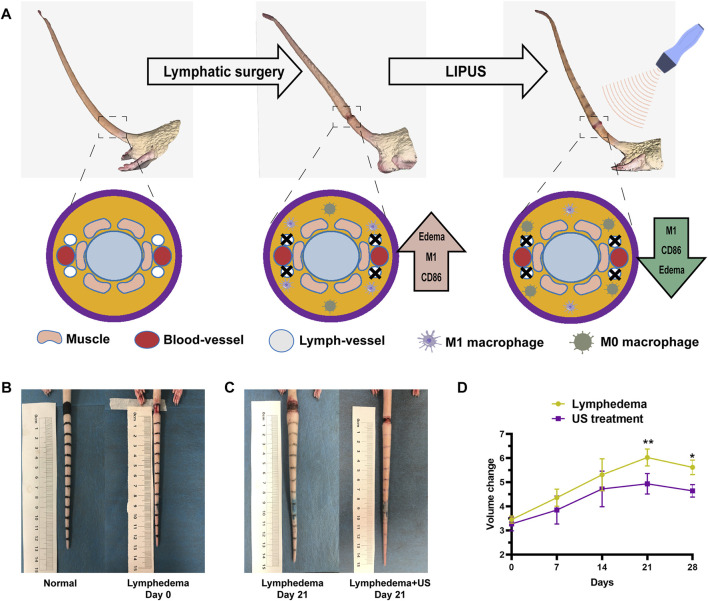
FIGURE 1.
The tail volume of the ultrasonic treatment group and the non-treatment group. (A) 3D simulation of acquired lymphedema surgery. The lymphatic network was eliminated. (B) Bright-field images of the acquired lymphedema surgery. (C) Images of the control group and LIPUS group on day 21. (D) The lymphedema tail volume responses of the LIPUS treatment group and the non-treatment group after a treatment course of 28 days. The volume was measured by the drainage method.

