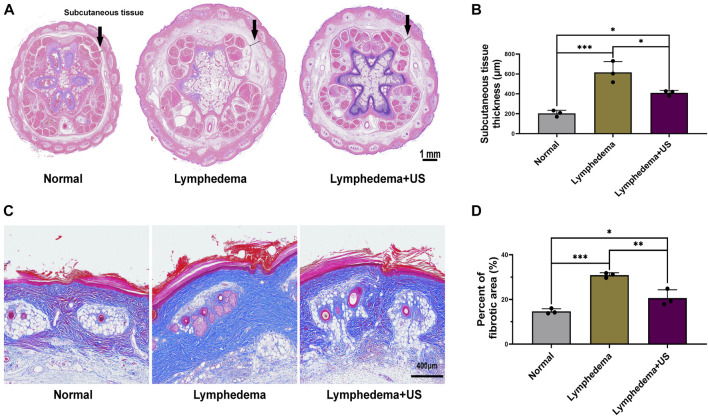
FIGURE 2.
Histological photomicrographs of lymphedema site of the control and LIPUS groups. (A,B) HE staining showing the thickness of subcutaneous tissue at the lymphedema site, scale bar = 1 mm. (C) Masson’s staining to evaluate fibrotic tissue deposition revealed a decrease in fibrosis after LIPUS, scale bar = 400 μm. (D) Percent of the fibrotic area at the lymphedema site (p < 0.05, n = 3).

