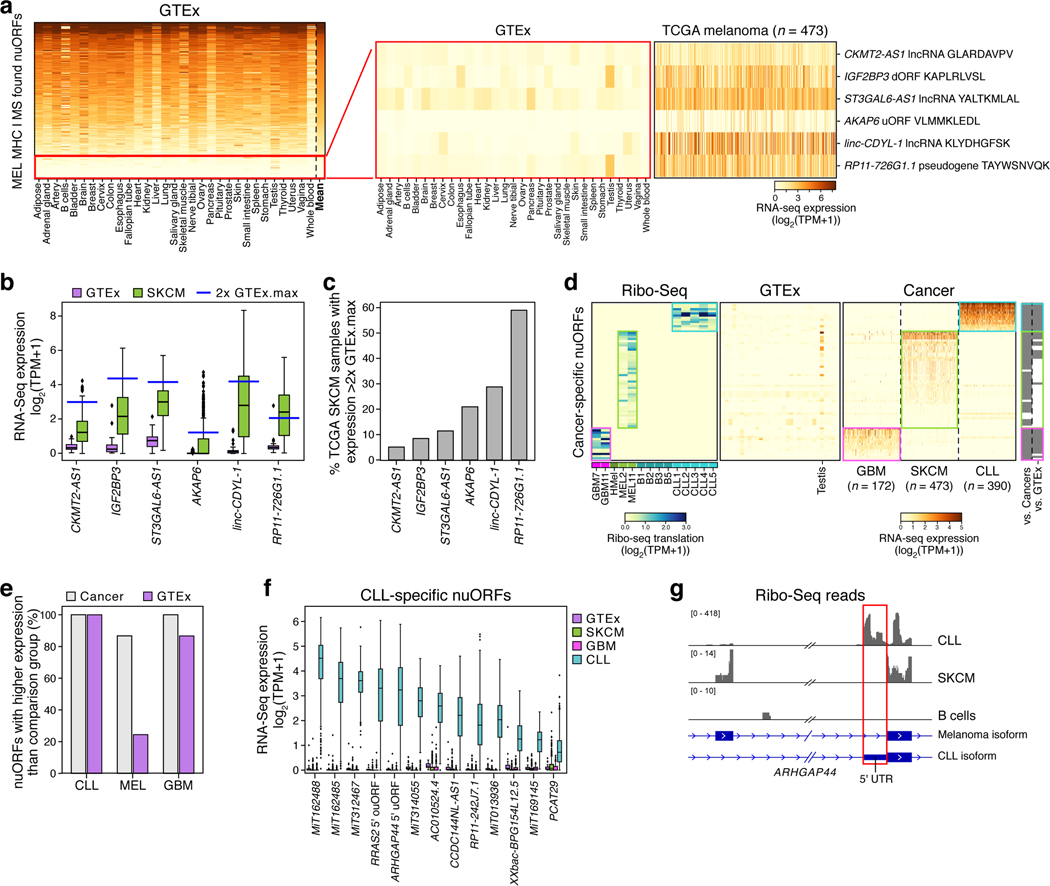
Figure 6. Cancer-enriched nuORFs are potential sources of cancer antigens.
a–c. MHC I MS/MS-detected nuORFs enriched in cancers may be potential sources of neoantigens. a. Expression level (log2(TPM+1)) of nuORFs (rows) detected in MHC I immunopeptidomes of 4 melanoma samples, ordered by mean expression (rightmost column) across all GTEx tissues (columns), except testis. Red box: nuORF at bottom 15% by mean expression (left), filtered for those expressed at least 2-fold higher than the maximum expression in GTEx in at least 5% of 473 melanoma samples in (TCGA) (right). b. Expression level (y-axis, log2(TPM+1)) of melanoma-enriched, MS/MS-detected nuORFs in GTEx (purple, n=10 donors/tissue across 31 tissues) and TCGA melanoma (green, n=473 donors) samples (x-axis). Blue line: 2x highest GTEx expression (testis excluded). c. Percent of TCGA melanoma samples (y-axis) with nuORF transcript (x-axis) expression greater than 2x highest GTEx expression. d–g. nuORFs specifically translated in cancers as potential sources of neoantigens. d. Left: Ribo-seq translation levels (log2(TPM+1)) of nuORFs (rows) exclusively translated in GBM (pink box), melanoma (green box) or CLL (teal box) samples (columns, left), with median expression < 1 TPM across GTEx tissues (columns, middle) (testis excluded), and their expression (log2(TPM+1)) in respective cancer samples (columns, right). Far right: Significantly higher expression (grey, p < 0.0001, rank-sum test) in expected cancer type vs. the other cancer types or vs. GTEx expression. e. Percent of nuORFs (y-axis) for each cancer type (x axis) with significantly higher expression (p < 0.0001, rank-sum test) in the expected cancer type than the other two cancer types (grey) or GTEx (purple) samples. f. Expression (y-axis, log2(TPM+1)) of CLL-specific nuORFs (x-axis) in CLL (teal, n=390 donors), GBM (pink, n=172 donors), melanoma (green, 473 donors), and GTEx (purple, n=10 donors/tissue across 31 tissues). g. CLL-specific ARHGAP44 5’ uORF (red box). Alternative transcript isoforms are translated in melanoma vs. CLL, and not translated in B cells. For all boxplots (B,F): median, with 25% and 75% (box range), and 1.5 IQR (whiskers) are shown.

