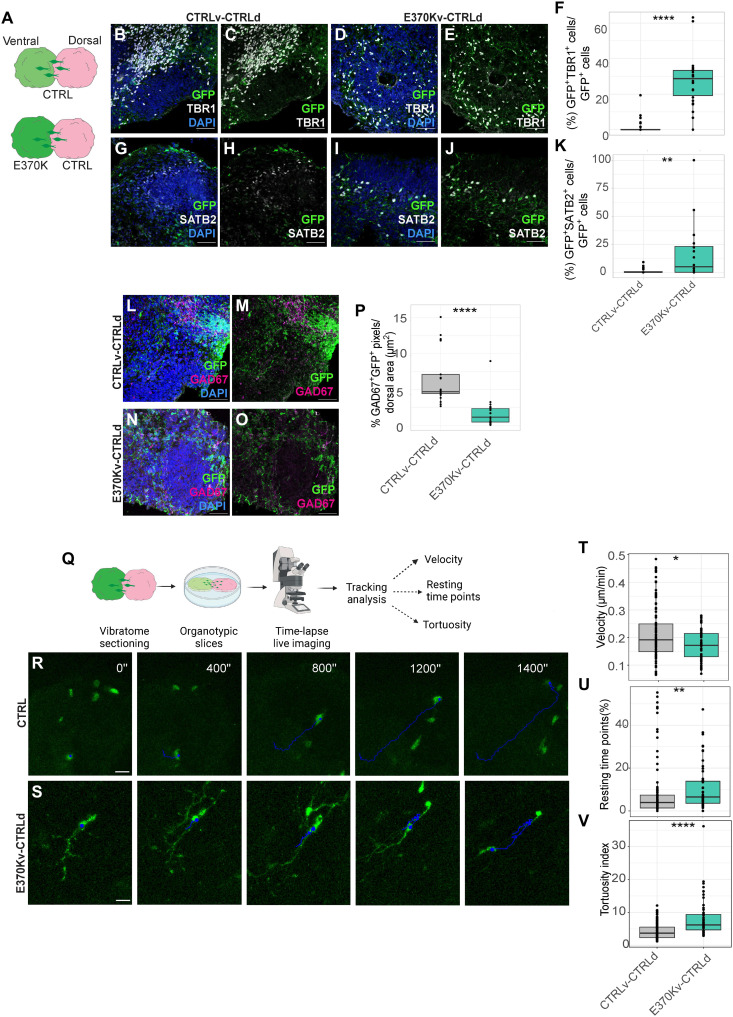
Fig. 3. Cell fate changes result in migratory dynamics defects.
(A) Schematic of the experimental setup showing dvCAs. (B to E) Micrograph of the dorsal region of D60 CTRLv-CTRLd (B) and (C) and E370Kv-CTRLd CAs (D) and (E) immunostained for green fluorescent protein (GFP) and TBR1. (F) Quantification of the percentage of GFP+ cells expressing TBR1 normalized by GFP+ cells in D60 CTRLv-CTRLd and E370Kv-CTRLd CAs. (G to J) Micrograph of the dorsal region of D60 CTRLv-CTRLd (G) and (H) and E370Kv-CTRLd CAs (I) and (J) immunostained for GFP and SATB2. (K) Quantification of the percentage of GFP+ cells expressing SATB2 normalized by GFP+ cells in D60 dvCAs. (L to O) Micrograph of the dorsal region of 60D CTRLv-CTRLd (L) and (M) and E370Kv-CTRLd (N) and (O) CAs immunostained for GFP and GAD67. (P) Quantification of the percentage of GFP+GAD67+ signal normalized by area (μm2) in D60 dvCAs. (Q) Schematic of the experimental setup for time-lapse live imaging in dvCAs. (R and S) Time-lapse live imaging of migrating GFP+ cells in organotypic slices of CTRLv-CTRLd (R) and E370Kv-CTRLd CAs (S). (T to V) Quantification of velocity (T), number of resting time points (U), and tortuosity index (V) of GFP+ cells in the dorsal side of dvCAs. Each individual data point represents one ventricle of dvCAs. Data are shown as means ± SEM. Statistical significance was based on the Mann-Whitney U test; *P < 0.05, **P < 0.01, and ****P < 0.0001. Scale bars, 50 μm (B) to (E), (G) to (J), and (L) to (O) and 80 μm (R) and (S).

