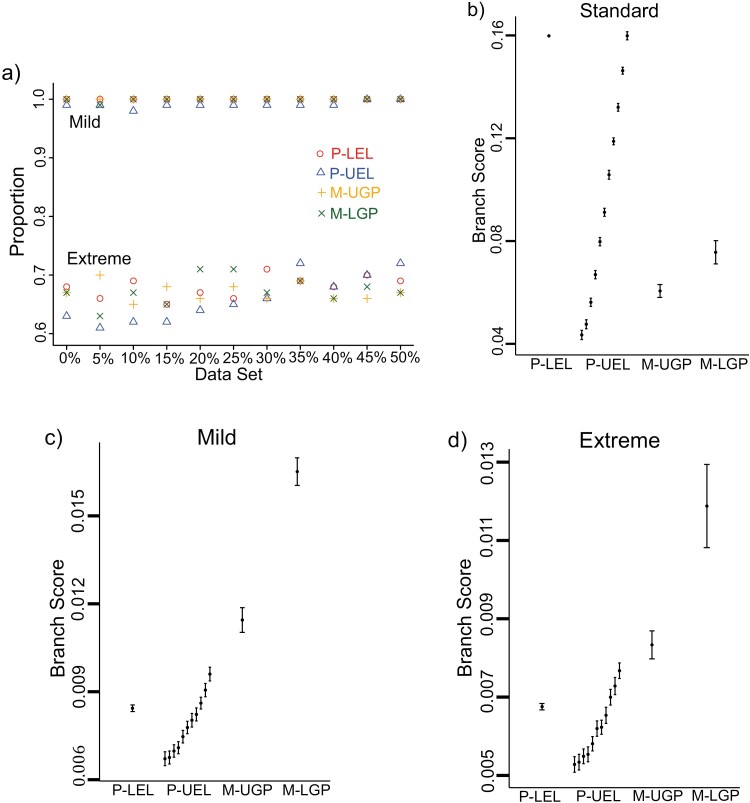
Figure 3.
Proportion of the MSAs with the inferred topology the same as the generating topology and branch scores of the inferred trees to the generating tree 1 for three simulations. (a) Proportion of the time the trees inferred by each model recovered the correct generating tree topologies for different group of MSAs in mild and extreme simulations. The result is not shown for standard simulation, since the inferred trees from four models in this simulation all correctly recovered the generating tree topologies. (b)–(d) The mean branch scores for three simulations. Vertical bars indicate standard errors of the mean branch scores. The 11 bars for the P-UEL models, from left to right, represent the branch scores, for 0% to 50% groups of MSAs, respectively. Only one bar is shown for the P-LEL and the mixture models since mispartitioning has little effect (less than 1% difference in the mean branch scores) on the performance of these models in estimating the generating edge lengths.

