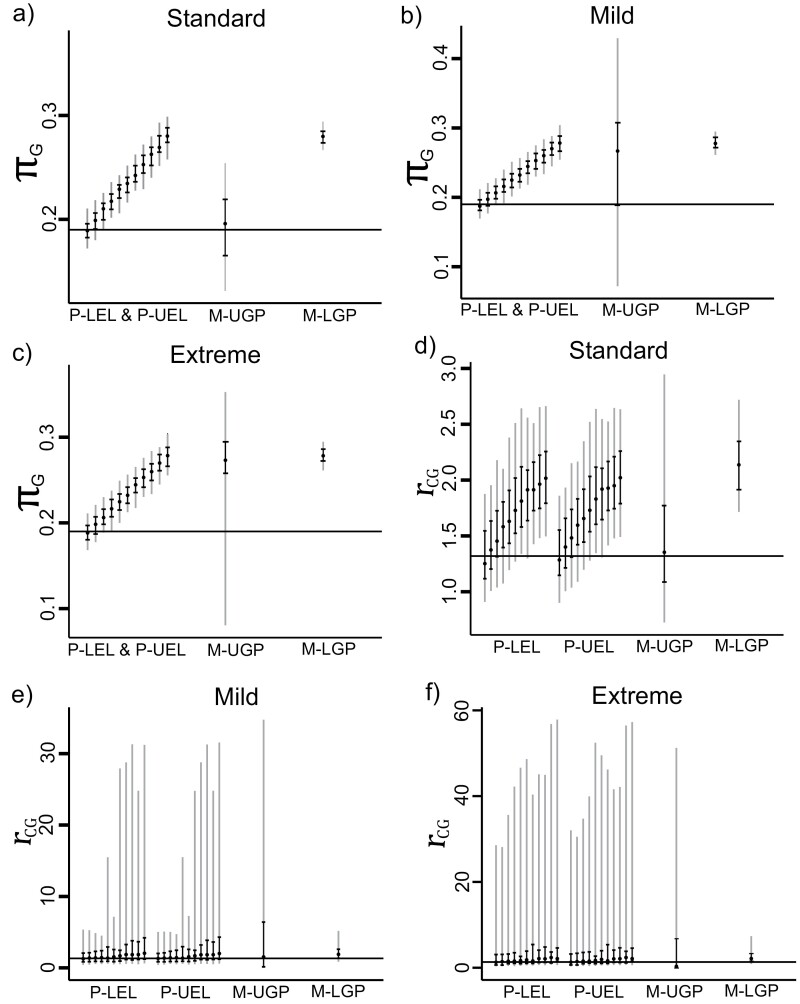
Figure 4.
Estimated base frequency (left) and evolutionary rate (right) of block one for three simulations. Each vertical bar indicates the (25th, 75th) percentiles (black) and the (5th, 95th) percentiles (grey) of the sampling distribution. The dot on each vertical bar shows the median estimated or . The horizontal solid black lines are the generating or from block one of the sequences. The estimated base frequencies of the two partition models were the same. The 11 bars for partition models, from left to right, represent the estimated or , for 0% to 50% groups of MSAs, respectively. Only one bar is shown for each mixture model since mispartitioning does not affect the performance of mixture models in estimating the generating parameters.

