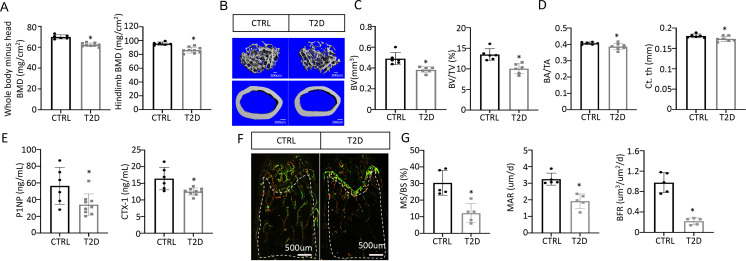
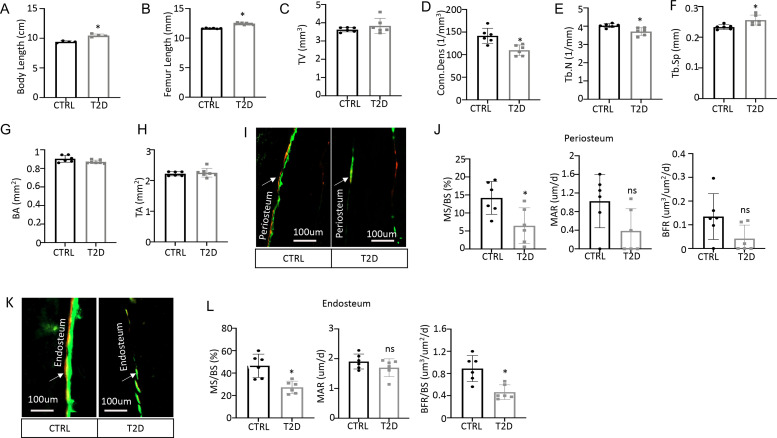
Figure 2. Type 2 diabetes (T2D) causes low turnover osteopenia.
(A) Bone mineral density (BMD) for the whole body (minus head) and one leg (femur and tibia). CTRL, n=6; T2D, n=9. (B) Representative µCT images. (C) Quantitative analysis of trabecular bone of the distal femur. n=6. (D) Quantitative analysis of cortical bone in femur. CTRL, n=6; T2D, n=7. (E) Serum bone formation (P1NP) and resorption (CTX-1) markers. CTRL, n=6; T2D, n=9. (F, G) Representative images (F) and quantification (G) for double labeling of trabecular bone in the distal femur. n=5. Data are mean ± SD. Unpaired Student’s t-tests. *p<0.05.


