. 2023 May 5;12:e85714. doi: 10.7554/eLife.85714

Figure 3. Type 2 diabetes (T2D) suppresses glucose metabolism in bone.

(A) A diagram for carbon tracing with 1313C6-Glc. (B) Relative pool size of glycolytic and TCA metabolites. CTRL, n=8; T2D, n=6. (C) Enrichment of specific isotopologues of metabolites relative to own pool. CTRL, n=8; T2D, n=6. (D) Relative enrichment of specific isotopologues normalized to Glc(m+6). CTRL, n=8; T2D, n=6. (E) Carbon enrichment of metabolites relative to own pool (left) and normalized to Glc(m+6) (right). CTRL, n=8; T2D, n=6. (F, G) Western blot images (F) and quantifications (G). n=3. Data presented as mean ± SD. *p<0.05, Two-tailed unpaired t-test.

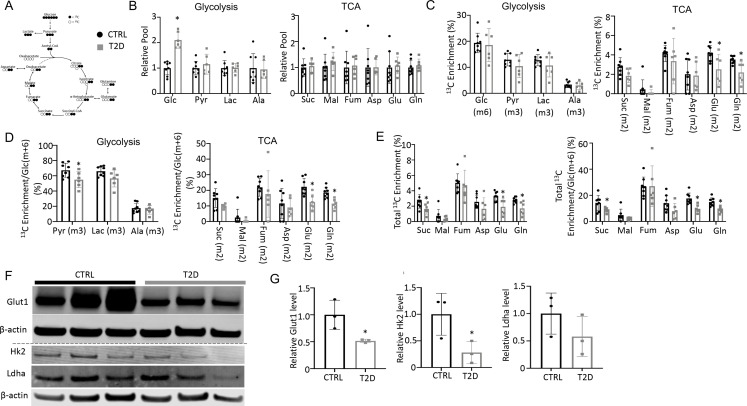
Figure 3—source data 1. Raw images of Western blots for Figure 3F.

Figure 3.

Figure 3—figure supplement 1. Glucose tracing in plasma.

Figure 3—figure supplement 1.

(A, B) Relative levels of glycolysis (A) and TCA (B) metabolites in the plasma. CTRL, n=8; T2D, n=6. Data are represented as mean ± SD. *p<0.05, Student’s t-test.
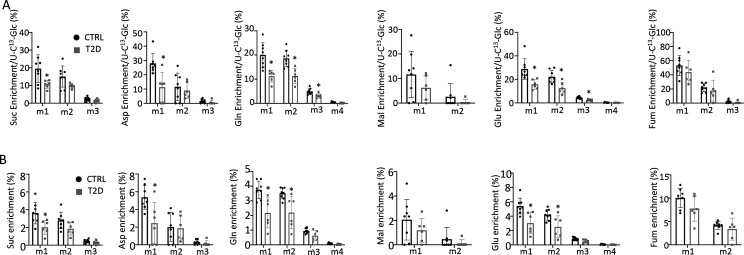
Figure 3—figure supplement 2. Glucose tracing in bone.

Figure 3—figure supplement 2.

(A) Relative enrichment of specific isotopomers normalized to 1313C6-Glc in bone. (B) Enrichment of specific isotopomers in bone. CTRL, n=8; T2D, n=6. Data are represented as mean ± SD. *p<0.05, Student’s t-test.