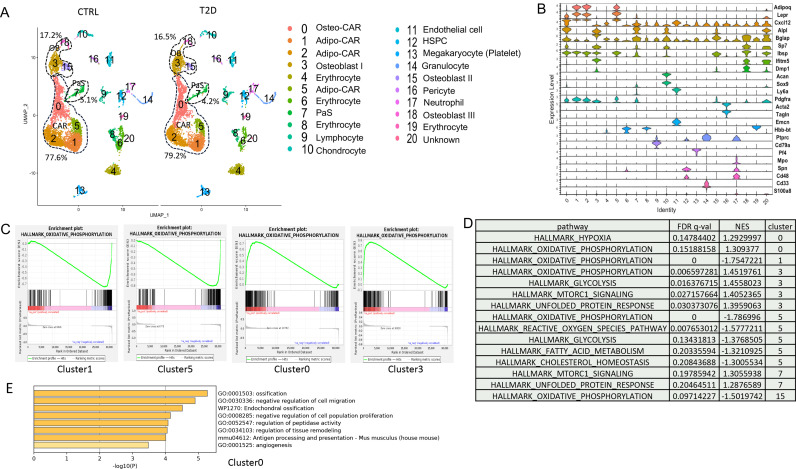
Figure 4. Single-cell RNA-sequencing (scRNA-seq) detects metabolic dysregulation in bone marrow mesenchymal cells of Type 2 diabetes (T2D) mice.
(A) UMAP clusters with annotations to the right. Percentages denote the relative abundance of osteoblast (OB), CAR, and PaS cells among mesenchymal cells. (B) Violin plots of the example feature genes for each cluster. (C) Gene set enrichment analysis (GSEA) of T2D over CTRL for OXPHOS pathway in clusters as indicated. (D) GSEA of T2D over CTRL for metabolic pathways in clusters as indicated. (E) Top pathways identified among T2D downregulated genes in cluster 0 with Metascape.

