. 2023 May 5;12:e85714. doi: 10.7554/eLife.85714

Figure 5. Type 2 diabetes (T2D) impairs glucose metabolism and osteogenic differentiation in bone marrow stromal cells (BMSC).

(A) Glucose uptake and lactate production rates. n=3. (B, C) Seahorse measurements of oxygen consumption rate (OCR) (B) and extracellular acidification rate (ECAR) (C). n=8. (D) Projected ATP production glycolysis (glycoATP) and mitochondria (mitoATP) based on Seahorse. n=8. (E, F) qPCR for osteoblast markers at day 4 (E) and day 7 (F) of differentiation. n=3. (G) Alizarin red staining. Data presented as mean ± SD. *p<0.05, Unpaired student’s t-test.

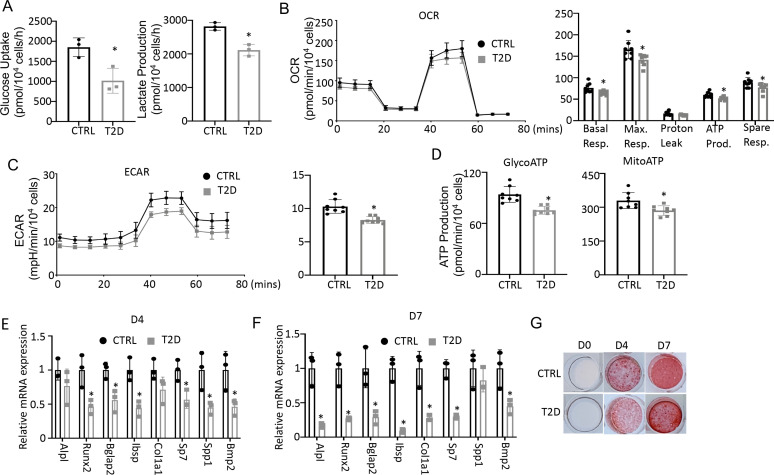
Figure 5.

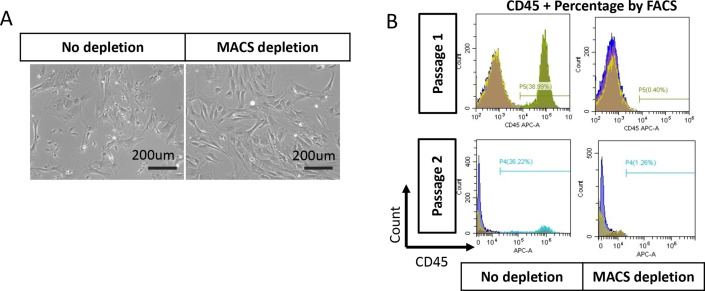
Figure 5—figure supplement 1. Bone marrow stromal cells (BMSC) purification with MACS beads.

Figure 5—figure supplement 1.

(A) Bright field of BMSC with or without depletion of CD45 + cells. (B) FACS analysis of CD45+ cell percentage for BMSC with or without depletion after one or two passages.
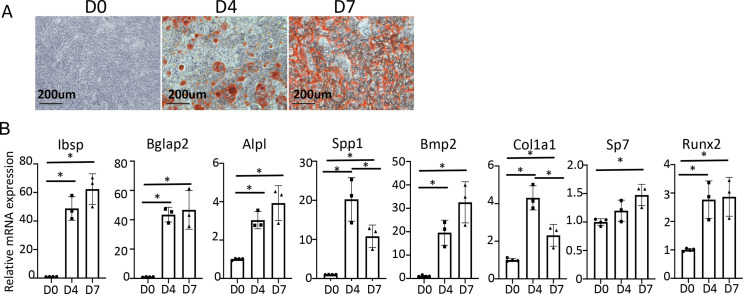
Figure 5—figure supplement 2. In vitro osteoblast differentiation of MACS-purified bone marrow stromal cells (BMSC) from wild-type mice.

Figure 5—figure supplement 2.

(A) Alizarin red staining with differentiation at day 0, day 4, and day 7. (B) qPCR of osteoblast marker genes. n=3. Data are represented as mean ± SD. *p<0.05, one-way ANOVA.