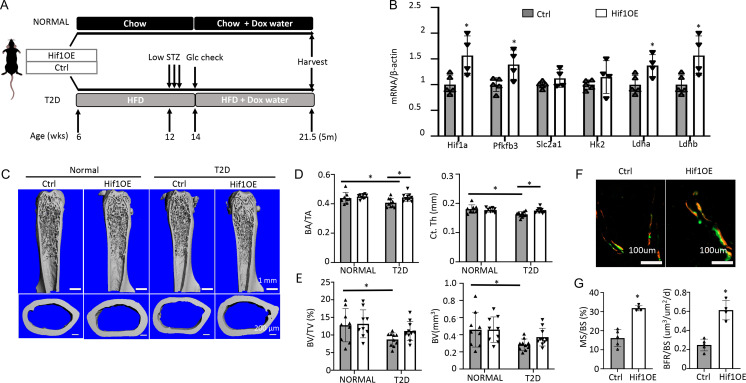
Figure 7. Targeted overexpression of Hif1a in osteoblasts rescues low bone mass in Type 2 diabetes (T2D) mice.
(A) A schematic for Hif1a overexpression (Hif1OE) in normal or T2D conditions. (B) qPCR analyses of glycolysis-related genes in bones of diabetic mice with or without Hif1a overexpression. n=4. (C–E) Representative µCT images (C) and quantification of cortical bone (D) and distal trabecular bone (E) of the femur. n=10. (F, G) Representative images (F) and quantification (G) of double labeling in trabecular bone of proximal tibia in diabetic mice. Ctrl, n=5, Hif1OE, n=4. Data presented as mean ± SD. *p<0.05 Unpaired Student’s t-test (B, G) or two-way ANOVA followed by Fisher’s LSD test (D, E).


