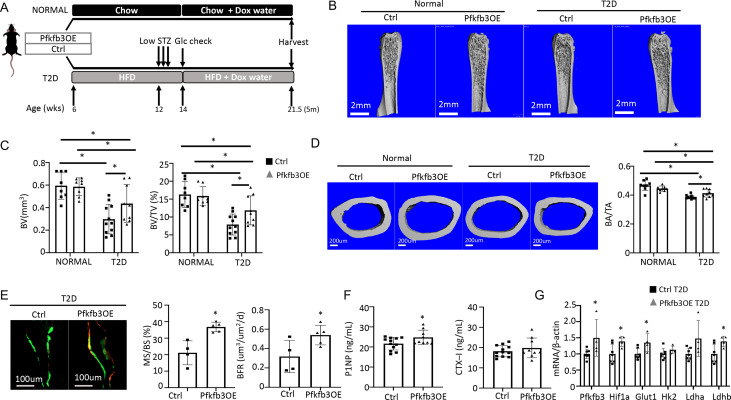
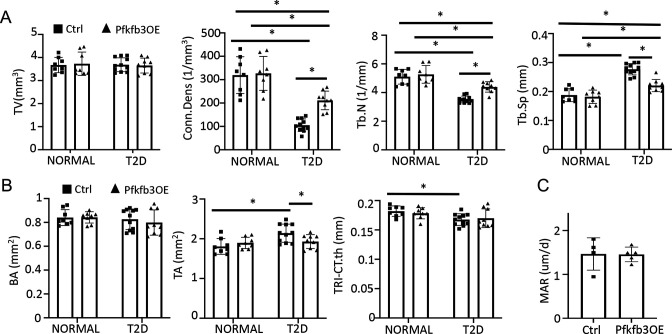
Figure 8. Osteoblast-directed Pfkfb3 overexpression corrects bone loss in Type 2 diabetes (T2D).
(A) A schematic for experimental design. Representative µCT images (B) and quantification (C) of trabecular bone in the distal femur. (D) Representative µCT images and quantification of cortical bone in femur. Ctrl NORMAL, n = 8; Pfkfb3OE NORMAL, n = 8; Ctrl T2D, n = 11; Pfkfb3OE T2D, n = 9. (E) Representative images and quantification of double labeling in trabecular bone of the proximal tibia. Ctrl T2D, n = 4; Pfkfb3OE T2D, n = 5. (F) Serum markers for bone formation (P1NP) and resorption (CTX-1). Ctrl T2D, n = 12; Pfkfb3OE T2D, n = 9. (G) qPCR analyses of glycolysis-related genes in bone. Ctrl T2D, n = 7; Pfkfb3OE T2D n = 4. Data presented as mean ± SD. *p<0.05, Two-way ANOVA followed by Fisher’s LSD test (C, D) or Student’s t-test (all others).


