
Figure 5.
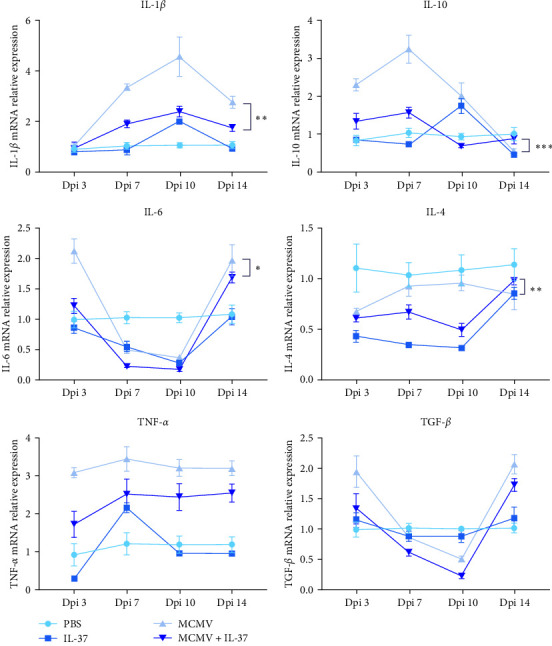
Effects of IL-37 on cytokine expression in the liver of MCMV-infected mice (n = 3 − 5 mice in each group). Each colored dot is for the mean value of a group and the vertical lines represent the standard error in a group of mice (n = 3). ∗P < 0.05, ∗∗P < 0.01, ∗∗∗P < 0.001.