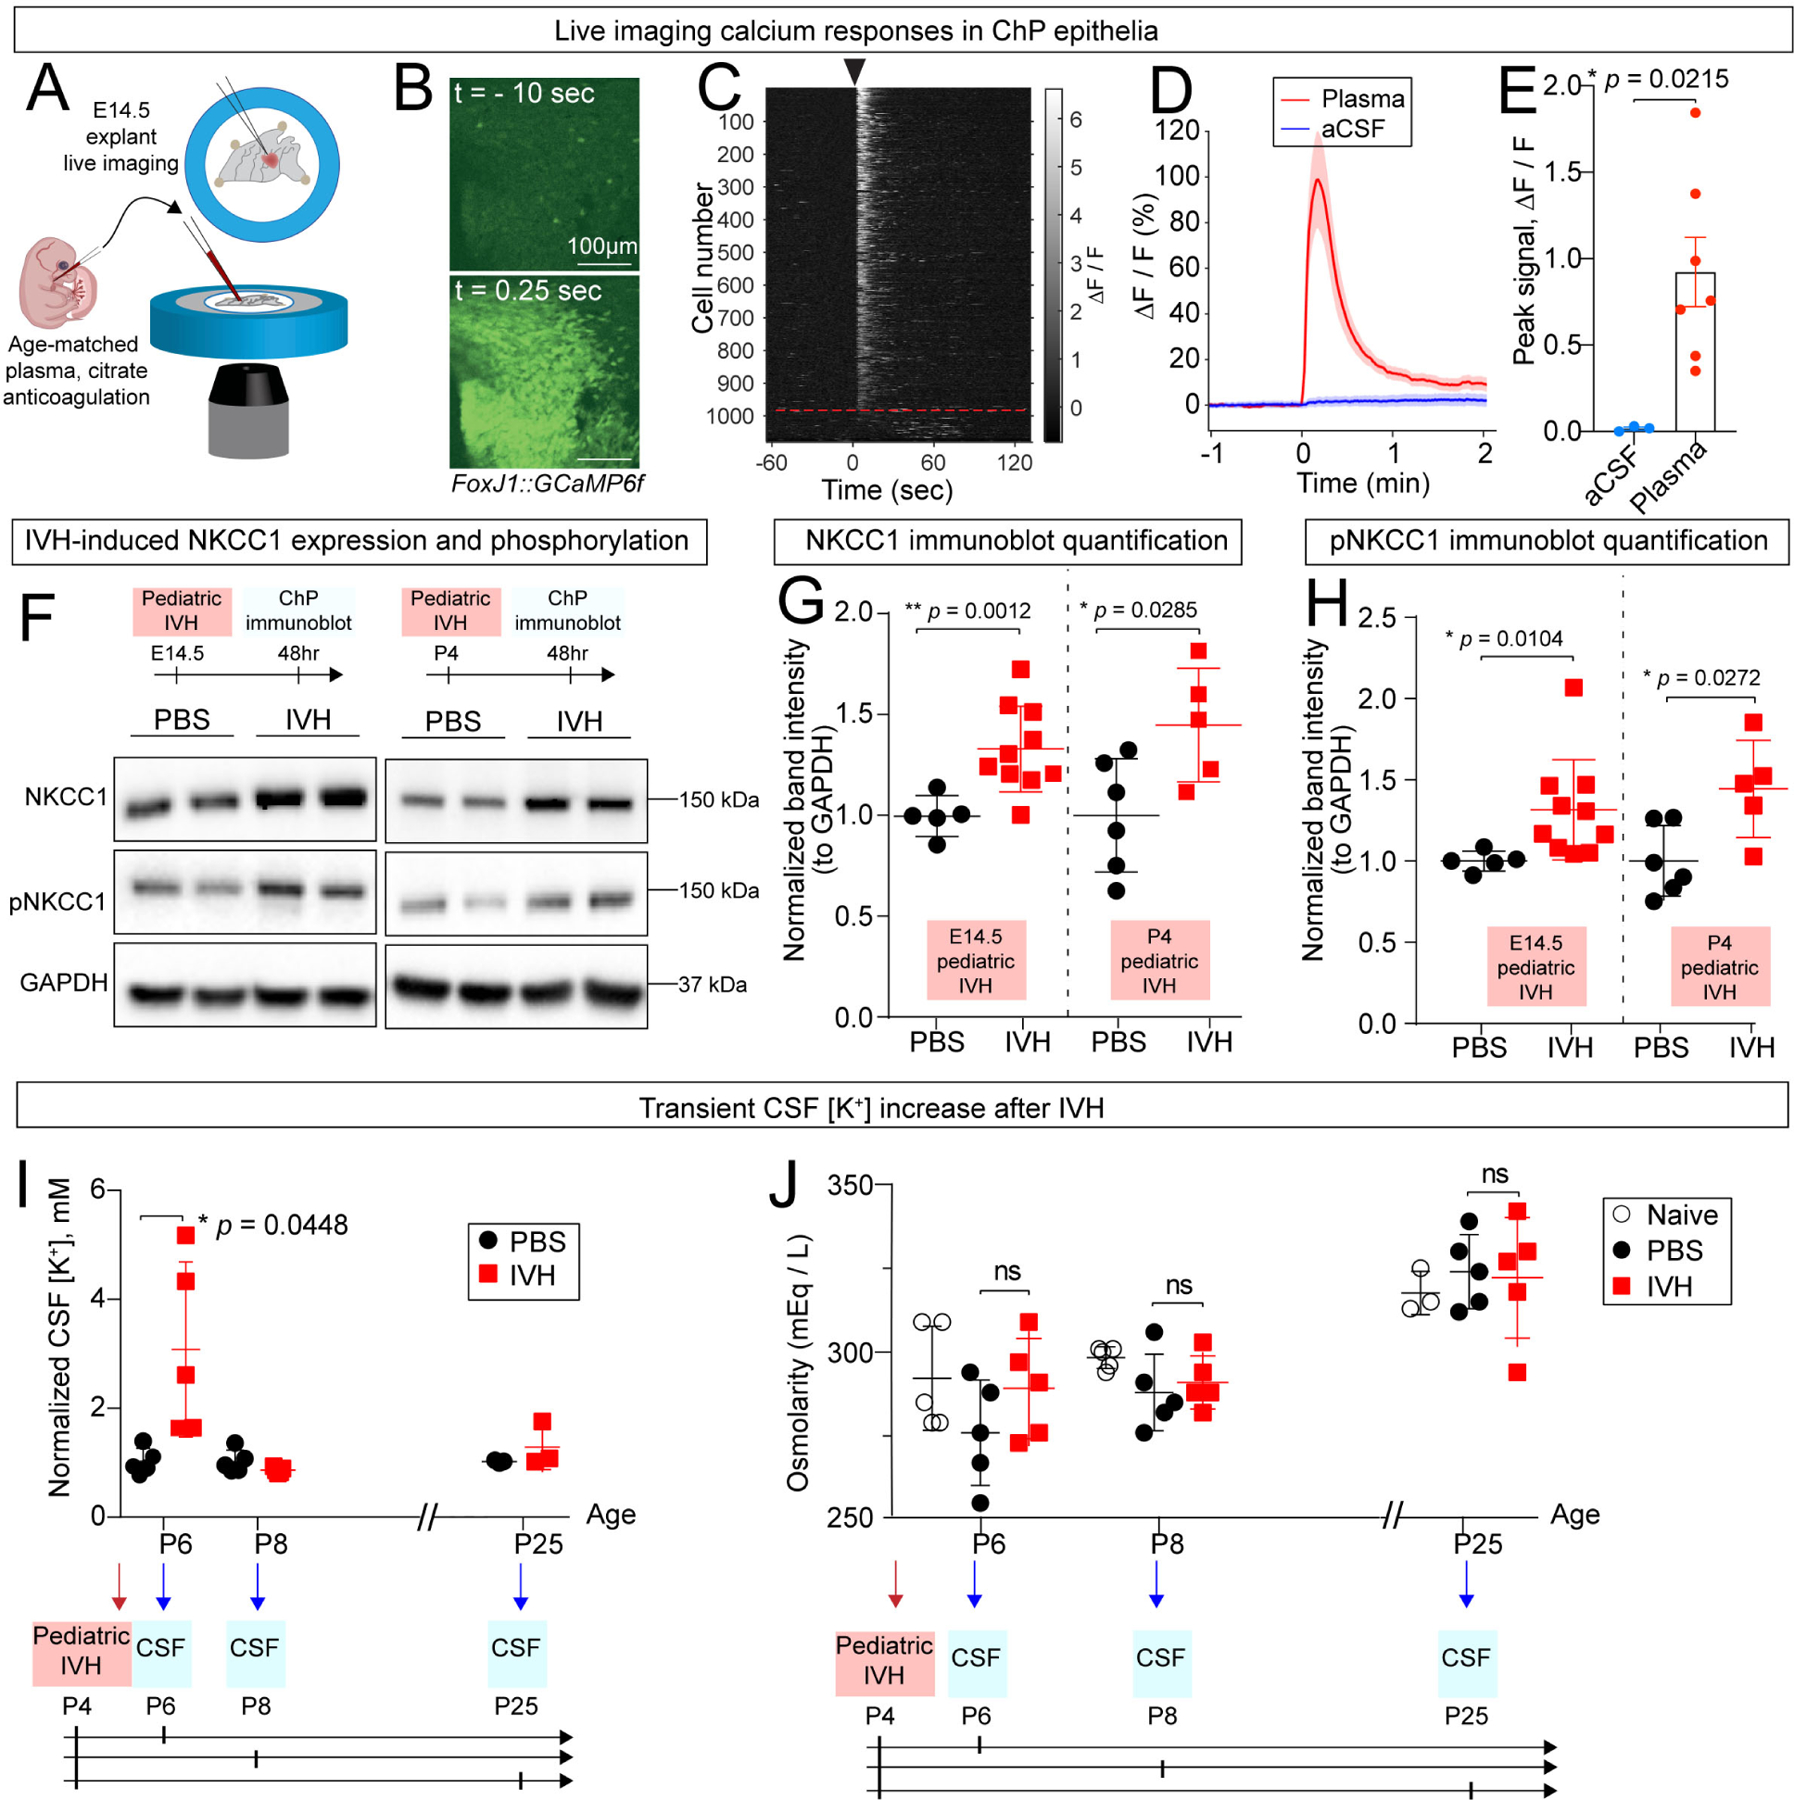
Figure 2. The ChP responds rapidly to ventricular blood exposure.

(A) Schematic depicting ChP explant imaging in response to blood exposure. (B) Two-photon calcium imaging of ChP explant (FoxJ1-Cre::GCaMP6f mice) shows increased response following application of plasma. Scale bar = 100 μm. Top: 10 seconds prior to plasma. Bottom: 0.25 sec after plasma exposure. (C) Two-photon calcium activity of epithelial cells shown in (B), sorted by peak activity within 25 seconds following application of plasma. Black arrow indicates onset of plasma. Red dashed line indicates cutoff of non-responder cells (responder cells were defined as those that exceeded the cutoff of 6 standard deviations or more above the pre-stimulation mean within 25 seconds of stimulus exposure), indicating that 91% (987 out of 1080) of ChP epithelial cells are sensitive to plasma. (D) Epifluorescence calcium activity of entire ChP explant following addition of plasma (red) and aCSF (blue). Shaded color zones indicate standard deviation (n = 7 mice for plasma, 3 for aCSF). (E) ChP calcium activity showing peak intensity. (F-H) IVH increased total ChP NKCC1 and pNKCC1 after 48 hrs. (G) E14.5: PBS N = 5, IVH N = 10, ** p = 0.0012; P4: PBS N = 6, IVH N = 5, * p = 0.02852. (H) E14.5: PBS N = 5, IVH N = 10, * p = 0.0104; P4: PBS N = 6, IVH N = 5, * p = 0.0272. Welch’s two-tailed unpaired t-test. Data presented as mean ± SD. (I) CSF [K+] increased 2 days after IVH and returned to baseline 4 days after IVH, * p = 0.0448. N = 5 for each condition, Welch’s two-tailed unpaired t-test. Data presented as mean ± SD. (J) CSF osmolarity remained unchanged by IVH. N = 5 for each condition except for uninjected Day 21, where N = 3. Each data point in Figure 2 represents one mouse, except for CSF data where each data point represents one biological replicate, and 2–3 mice were pooled in each biological replicate to reach sufficient CSF volume for performing the assay.
