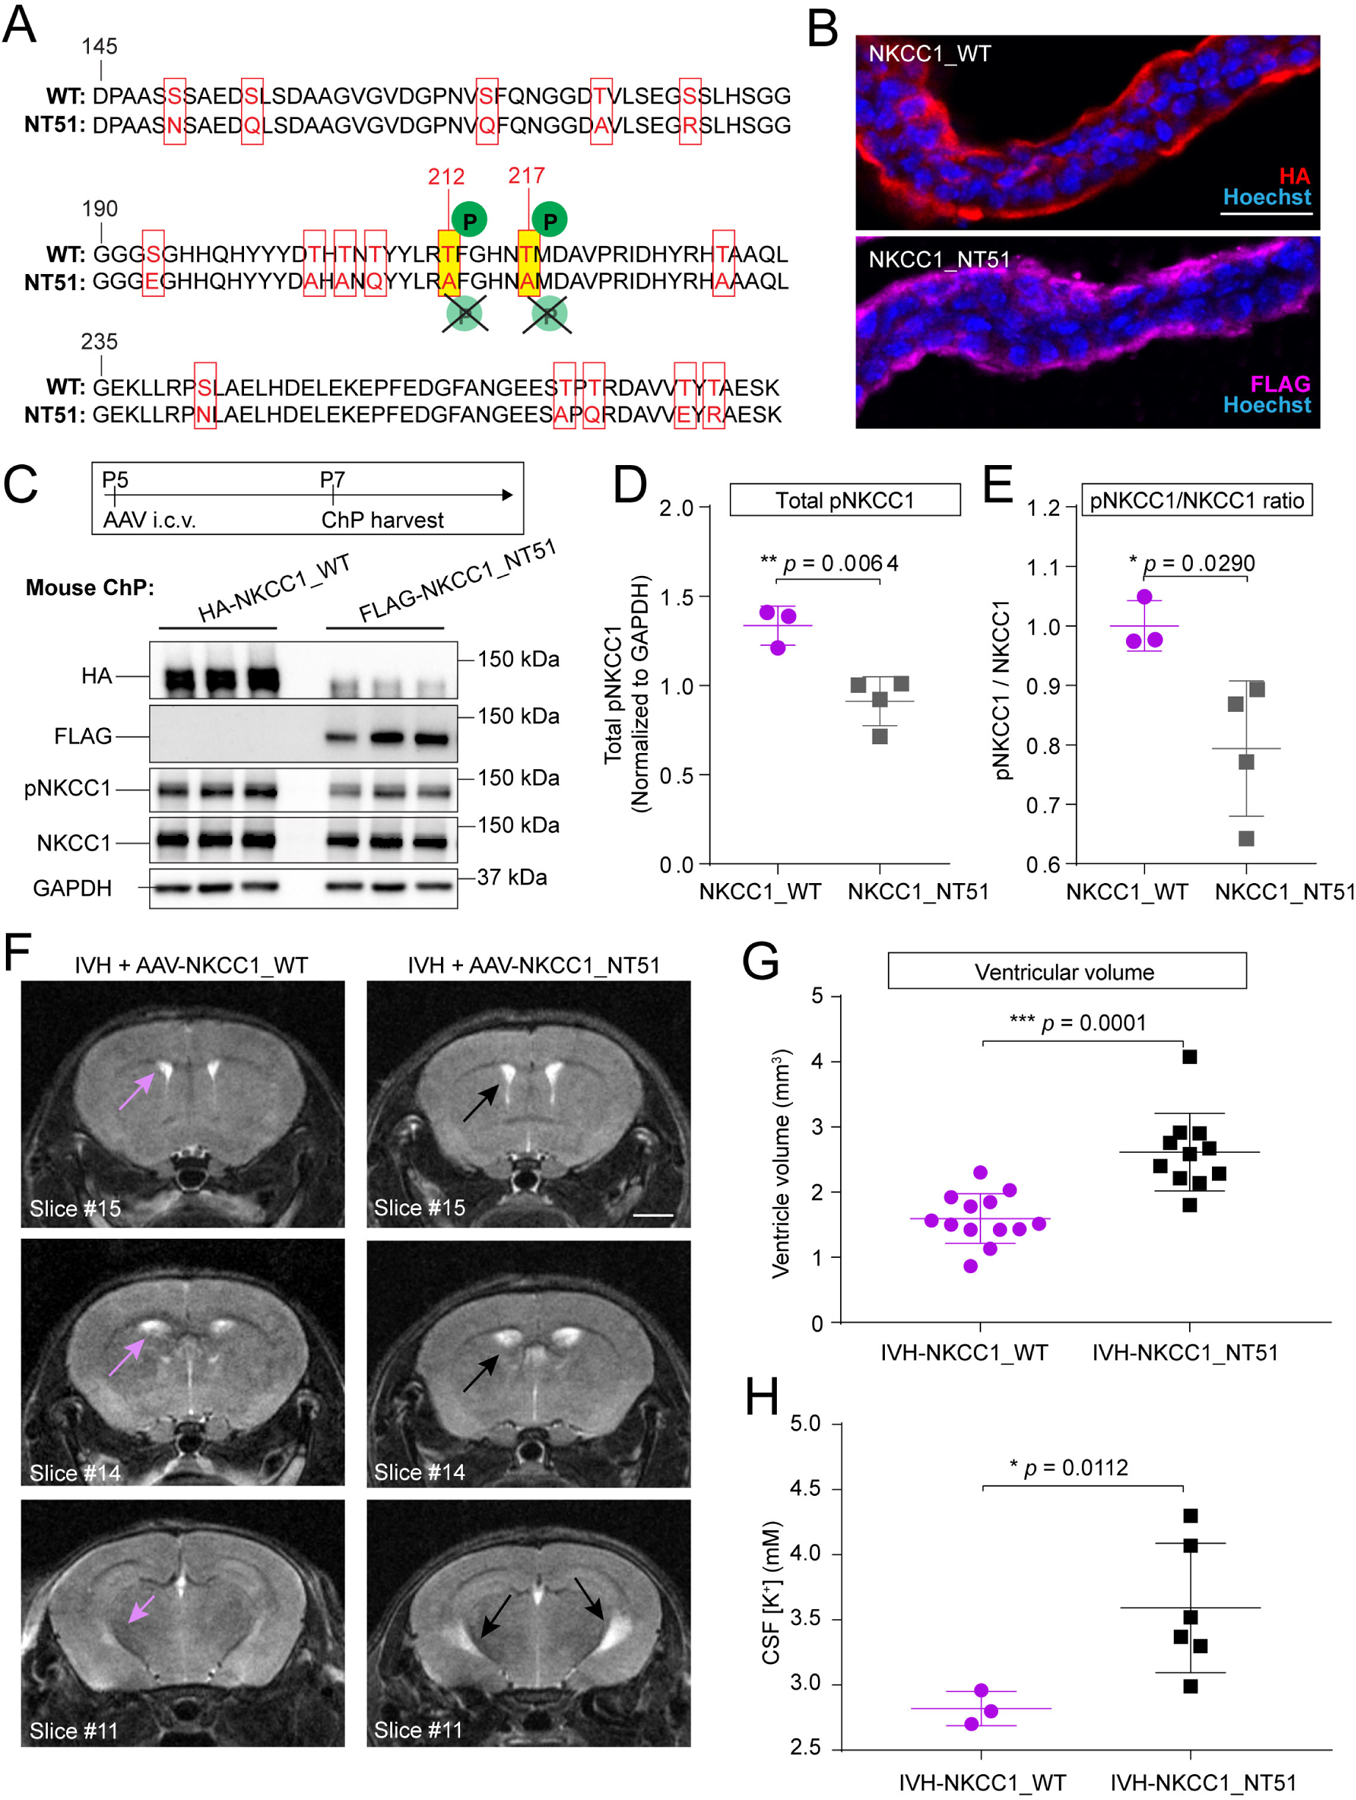
Figure 4. Inactive NKCC1 fails to mitigate ventriculomegaly in IVH mice.

(A) Alignment of sequences in the regulatory domain of WT and NKCC1_NT51 shows residues with silent inactivating mutations in NKCC1_NT51. (B) ChP apical localization of both WT and NKCC1_NT51, identified by HA and FLAG, respectively. Scale = 25 μm. (C) P5 pups expressing AAV-NKCC1_NT51 had lower pNKCC1 level than littermates expressing AAV-NKCC1_WT. (D-E) Lower pNKCC1 (D) and lower pNKCC1/NKCC1 ratio (E) by AAV-NKCC1_NT51. AAV-NKCC1_WT N=3, AAV-NKCC1_NT51 N=4. Welch’s two-tailed unpaired t-test. Data presented as mean ± SD. (F-G) Representative T2-MRI images and quantification of ventricular volume in IVH mice treated with AAV-NKCC1_WT (purple arrows denote ventricles) or AAV-NKCC1_NT51 (black arrows denote ventricles). Scale = 2 mm. IVH+AAV-NKCC1_WT, N = 13; IVH+AAV-NKCC1_NT51 N = 11, *** p = 0.0001. Welch’s two-tailed unpaired t-test. Data presented as mean ± SD. (H) CSF [K+] was higher in IVH mice treated with AAV-NKCC1-NT51 compared to mice treated with wild-type AAV-NKCC1 3 days following IVH. Wild-type AAV-NKCC1: N=3 (pooled across 10 pups); AAV-NKCC1-NT51: N=6 (pooled across 16 pups), * p = 0.0112. Welch’s two-tailed unpaired t-test. Data presented as mean ± SD.
