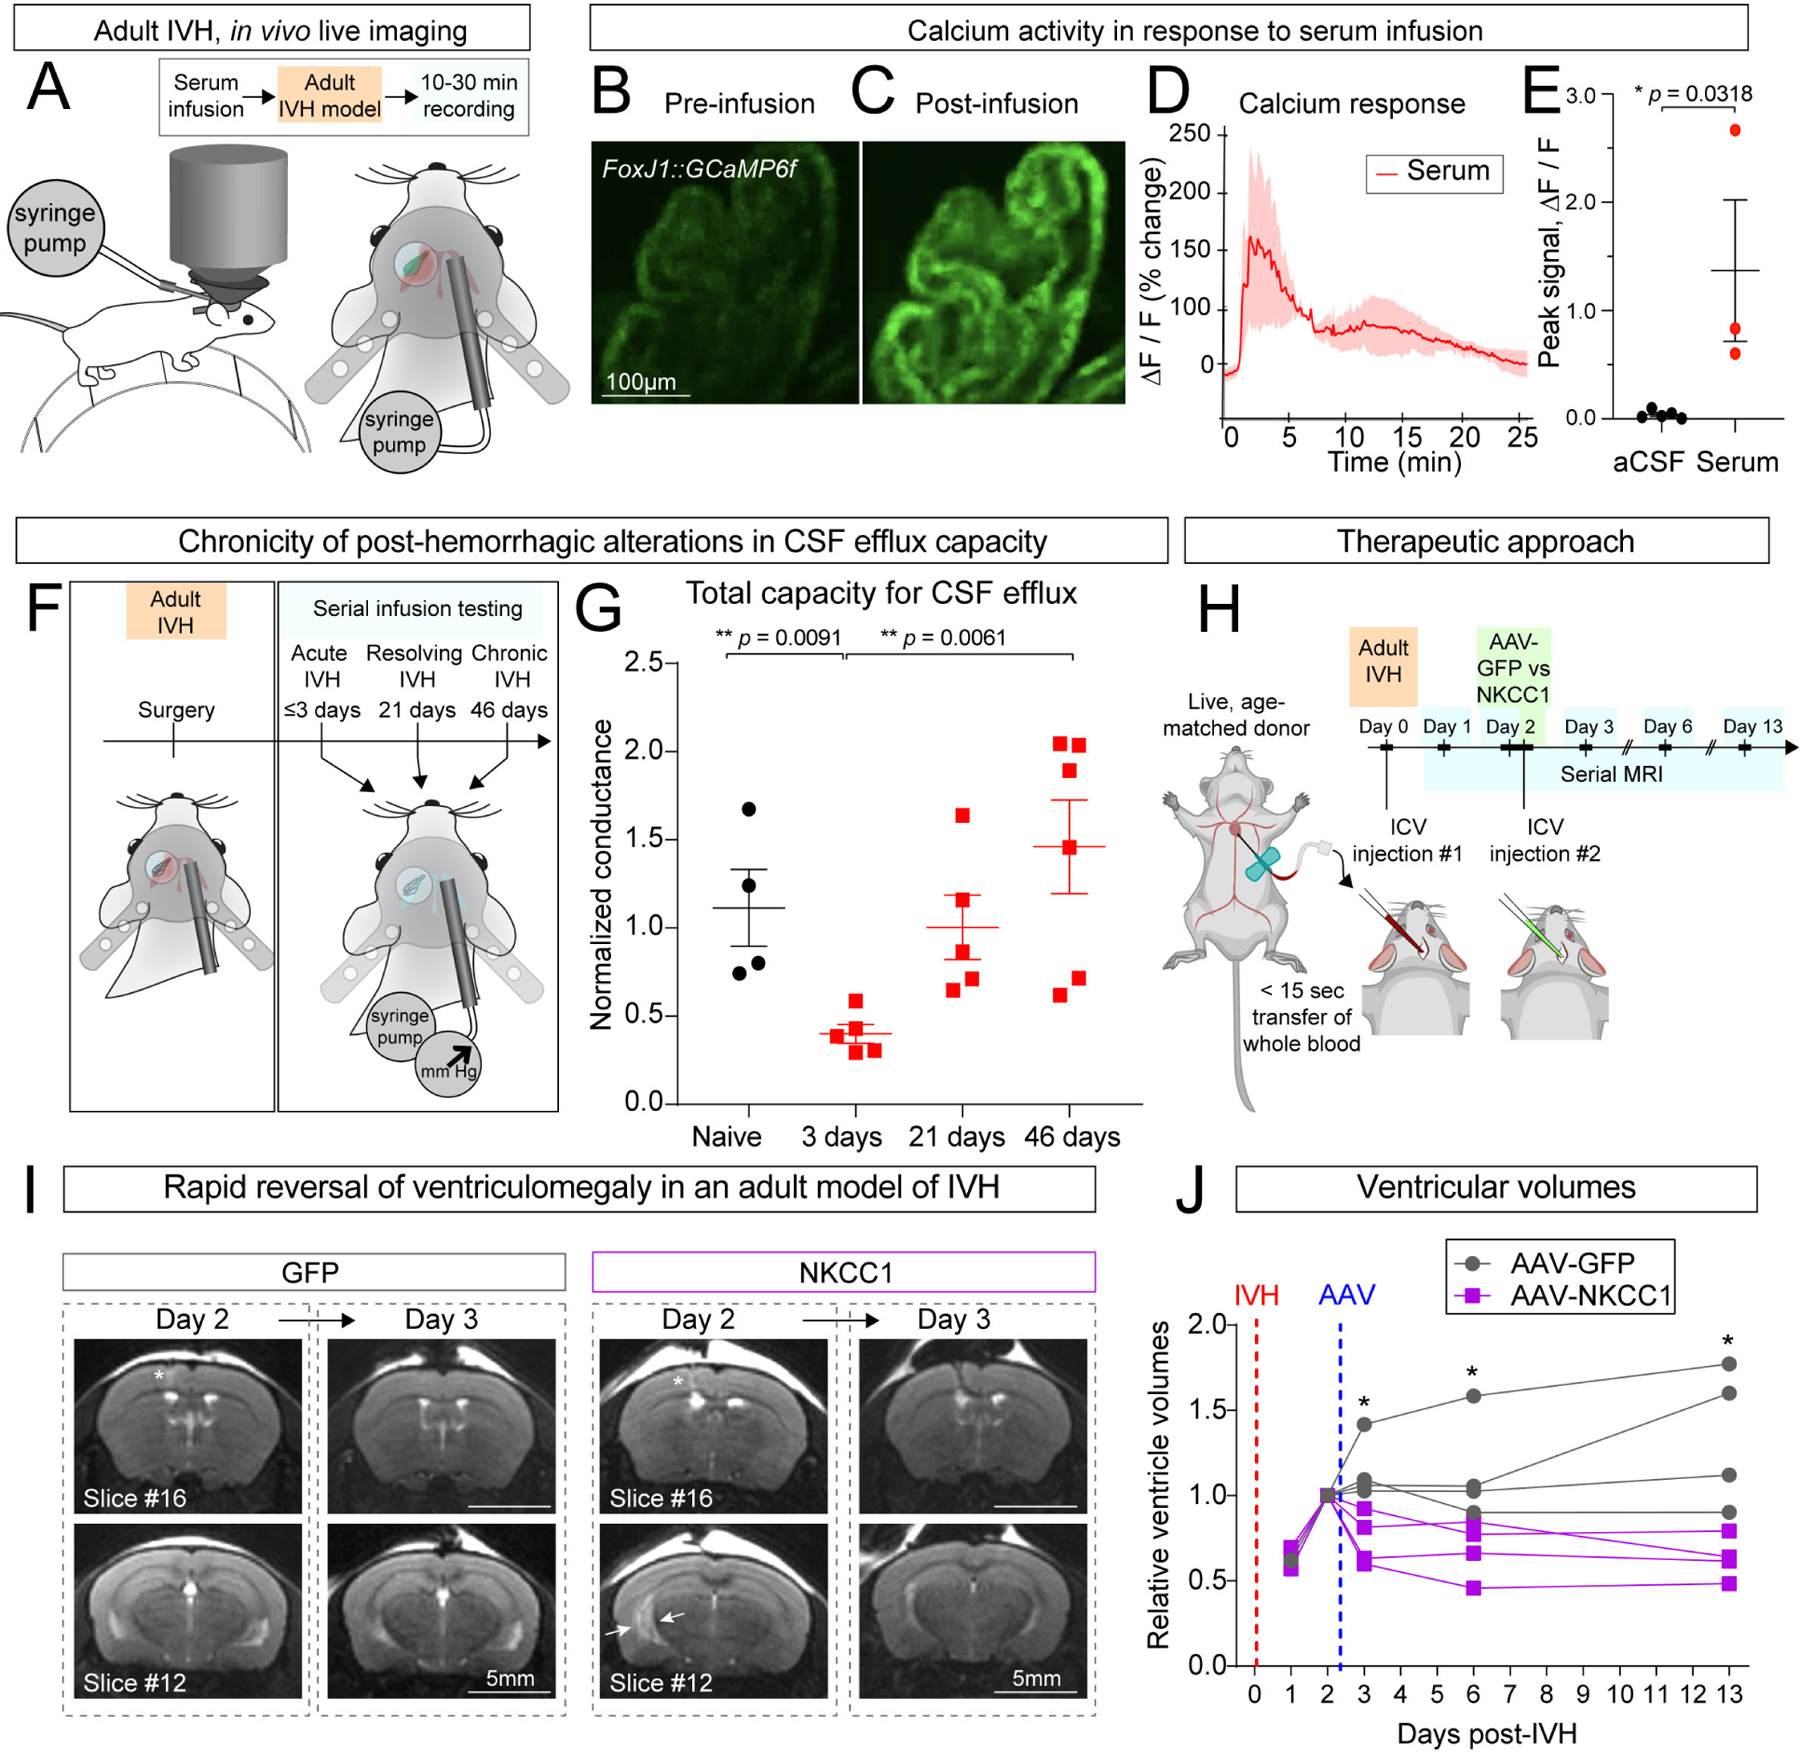
Figure 5. Adult mouse model of PHH mirrors key aspects of pediatric PHH and responds to ChP-NKCC1 therapy.

(A) Schematic depicting devices and surgical implantation for in vivo ChP live-imaging with two-photon microscopy. (B-C) Calcium responses to serum in ChP epithelial cells (FoxJ1-Cre::GCaMP6f mice) in vivo. Scale bar = 100 μm. (D-E) Representative fluorescence intensity trace with serum infusion and quantification of peak intensity. aCSF N = 4, serum N = 3. * p = 0.0318. Welch’s two-tailed unpaired t-test. Data presented as mean ± SD. (F) Schematic depicting adult IVH serial infusion test post-IVH. (G) Adult CSF clearance capacity post-IVH measured by infusion test. Naïve: N = 3, 3 days: N = 5, 21 days: N = 5, 46 days: N = 6. ** p = 0.0091, ** p = 0.0061. Welch’s two-tailed unpaired t-test. Data presented as mean ± SD. (H) Schematic depicting the therapeutic approach in adult PHH model and the time-course of serial MRI. (I) Representative T2-MRI images showing rapid reversal of ventriculomegaly in adult PHH model by ChP-NKCC1 overexpression. AAV-GFP was used as control. Scale = 5 mm. (J) Relative ventricular volume in adult PHH mice with AAV-NKCC1 treatment or control. For each mouse, the ventricular volumes on different days were normalized to the value of Day 2 post-IVH, immediately prior to AAV transduction. N = 4, * p < 0.05 (Day 3: p = 0.0138; Day 6: p = 0.0386; Day 13: p = 0.0152). Data analyzed by multiple t-test and corrected for multiple comparisons using Holm-Sidak method. Each data point represents one mouse.
