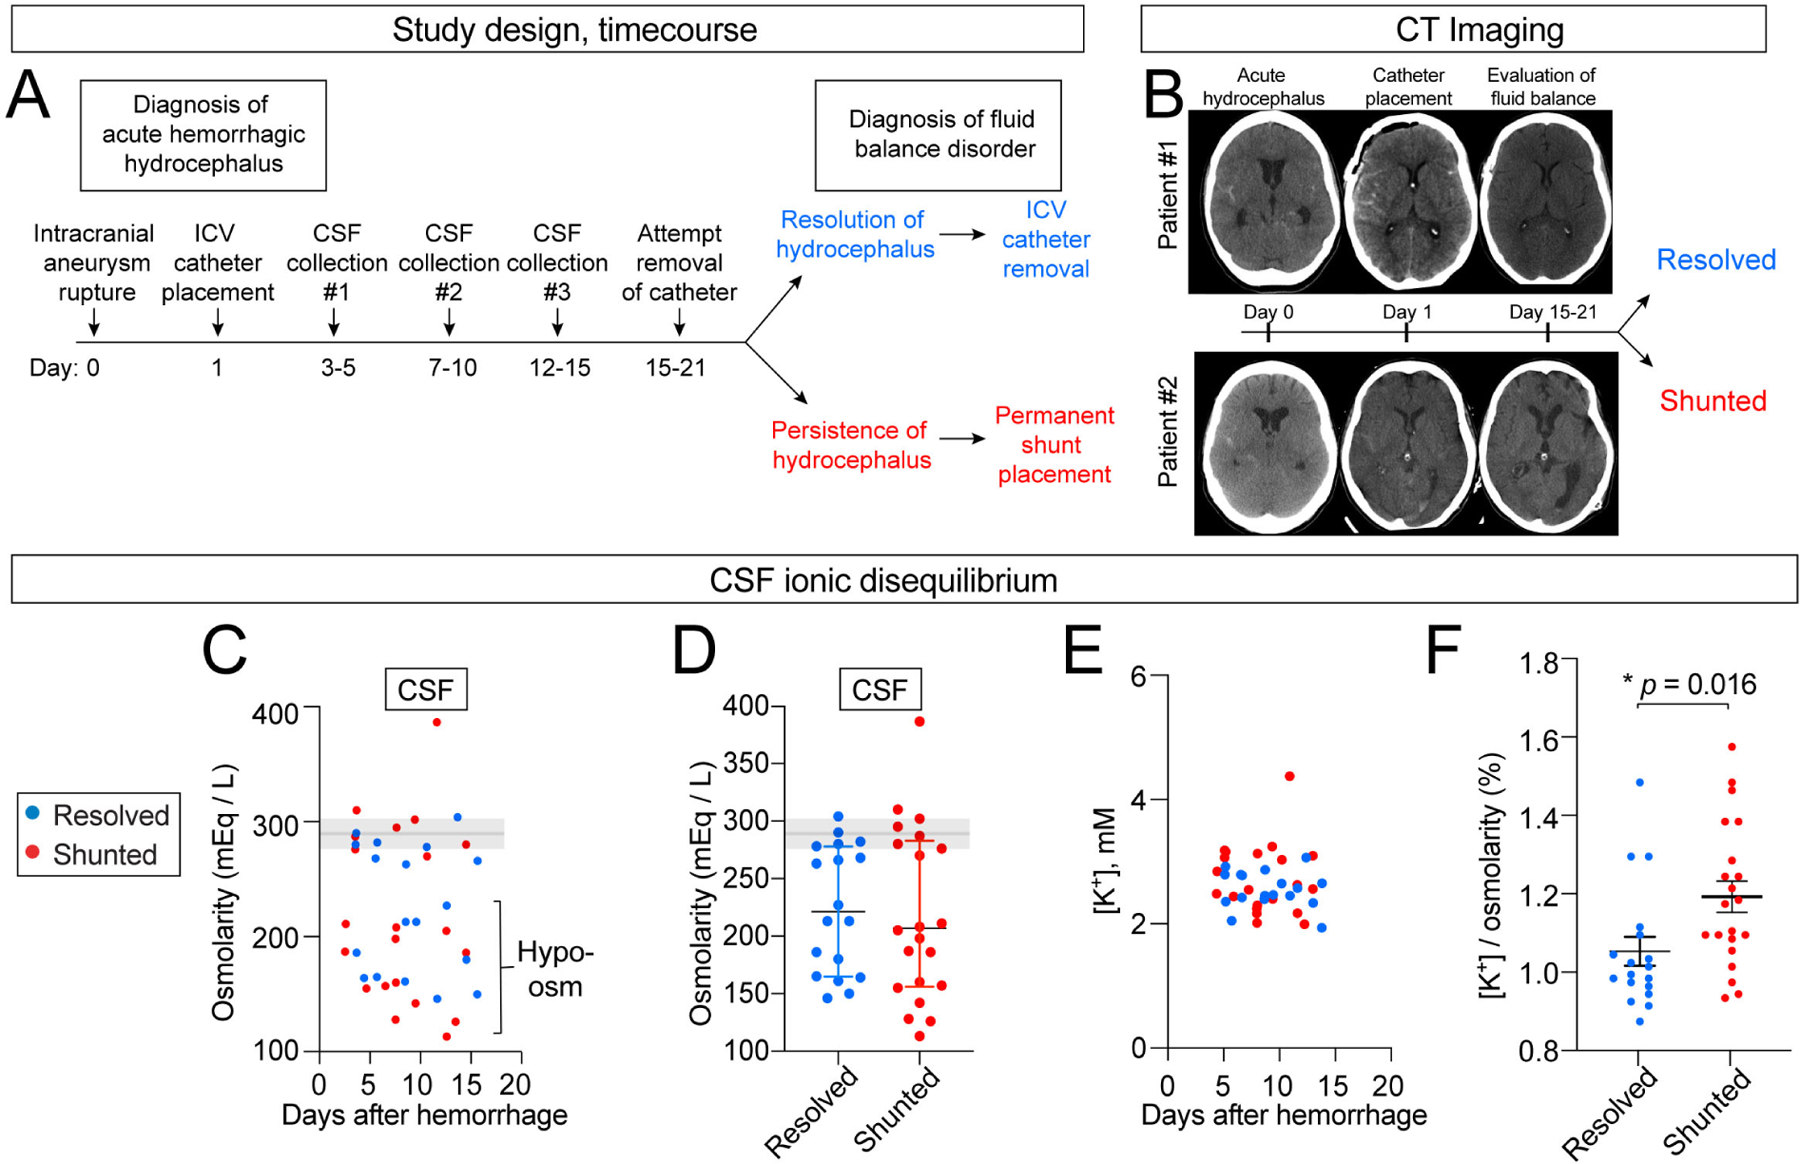
Figure 6. Adult human CSF shows positive correlation between post-SAH / IVH ionic disturbance and shunted outcome.

(A) Study design. (B) Representative CT images from patients with resolved (#1) vs. shunted (#2) hydrocephalus. (C-D) CSF osmolarity decreased in some CSF samples regardless of disease course. Shaded area shows 95% normal values.74 Blue: resolved, N = 18 (7 patients, 2–3 timepoints per patients). Red: shunted, N = 21 (8 patients, 2–3 timepoints per patient). (E-F) Absolute CSF [K+] was not altered but relative CSF [K+] to total osmolarity was higher in individuals requiring permanent shunting vs. individuals who recovered and had initial ventricular catheter removed. Blue: resolved, N = 18 (7 patients, 2–3 timepoints per patients). Red: shunted, N = 21 (8 patients, 2–3 timepoints per patient). * p = 0.016. Welch’s two-tailed unpaired t-test. All data presented as mean ± SD. Each data point represents one CSF sample collected from one patient at a single timepoint.
