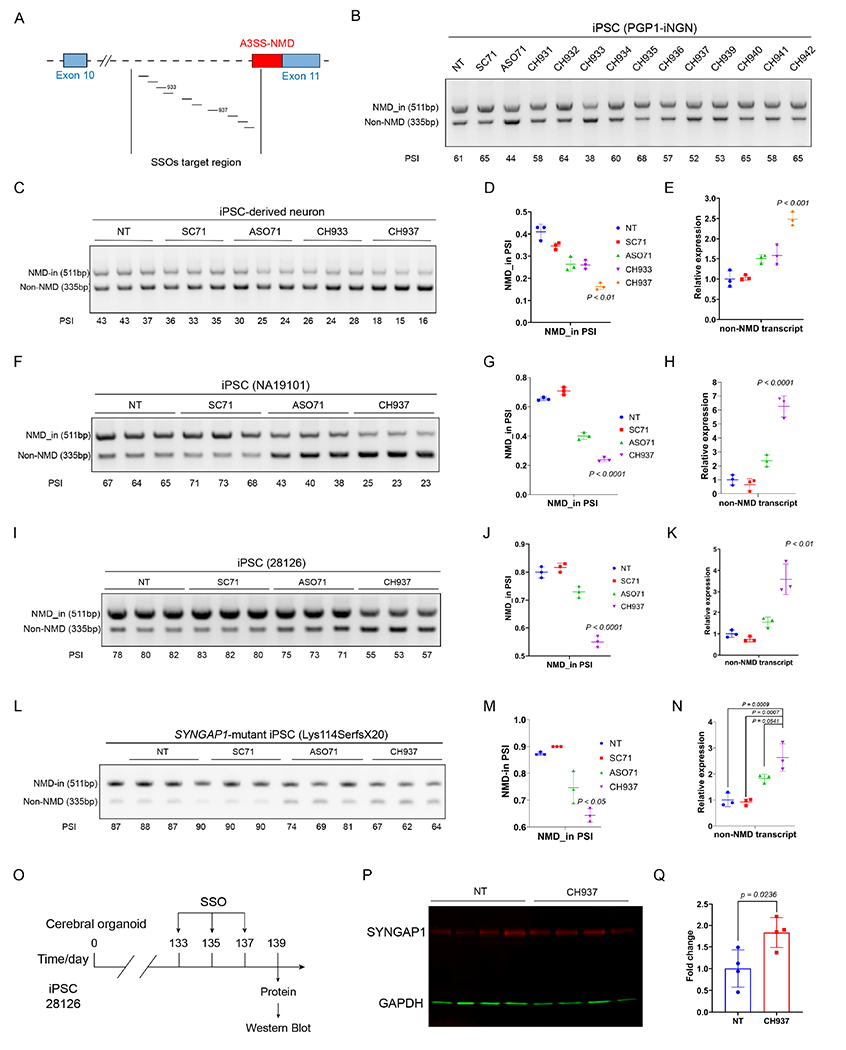
Figure 6. The lead SSO upregulates SYNGAP1 expression in human iPSCs and iPSC-derived neurons.

A) Schematic illustration of the SSO design targeting the SYNGAP1 A3SS.
B) RT-PCR results showing the screening of SSOs in iPSCs (PGP1-iNGN). One biological sample per lane.
C-E) Identification of the lead SSO in iPSC-derived neurons. RT-PCR results (C) and quantification (D) showing that CH937 suppresses SYNGAP1 A3SS in iPSC-derived neurons. Q-PCR results (E) showing that the productive SYNGAP1 transcript was upregulated in CH937-treated human iPSC-derived neurons.
F-K) The lead SSO suppresses SYNGAP1 A3SS in two additional human iPSC lines. RT-PCR results (F, I) and quantification (G, J) showing that CH937 suppressed SYNGAP1 A3SS in human iPSCs (NA19101 and 28126). Q-PCR results (H, K) showing that the CH937 significantly increased the productive SYNGAP1 transcript levels in human iPSC lines.
L-N) The lead SSO suppresses SYNGAP1 A3SS-NMD in SYNGAP1 patient-derived iPSCs. RT-PCR results (L) and quantification (M) showing that CH937 suppressed SYNGAP1 A3SS in SYNGAP1 patient-derived iPSCs (333del, Lys114SerfsX20). Q-PCR results (N) showing that the CH937 significantly increased the productive SYNGAP1 mRNA level.
O-Q) Application of CH937 to human iPSC-derived cerebral organoids (O) led to increased SYNGAP1 protein expression (83%±28%, P-Q). p<0.05 by unpaired t-test.
See also Figure S6.
