Figure 7.
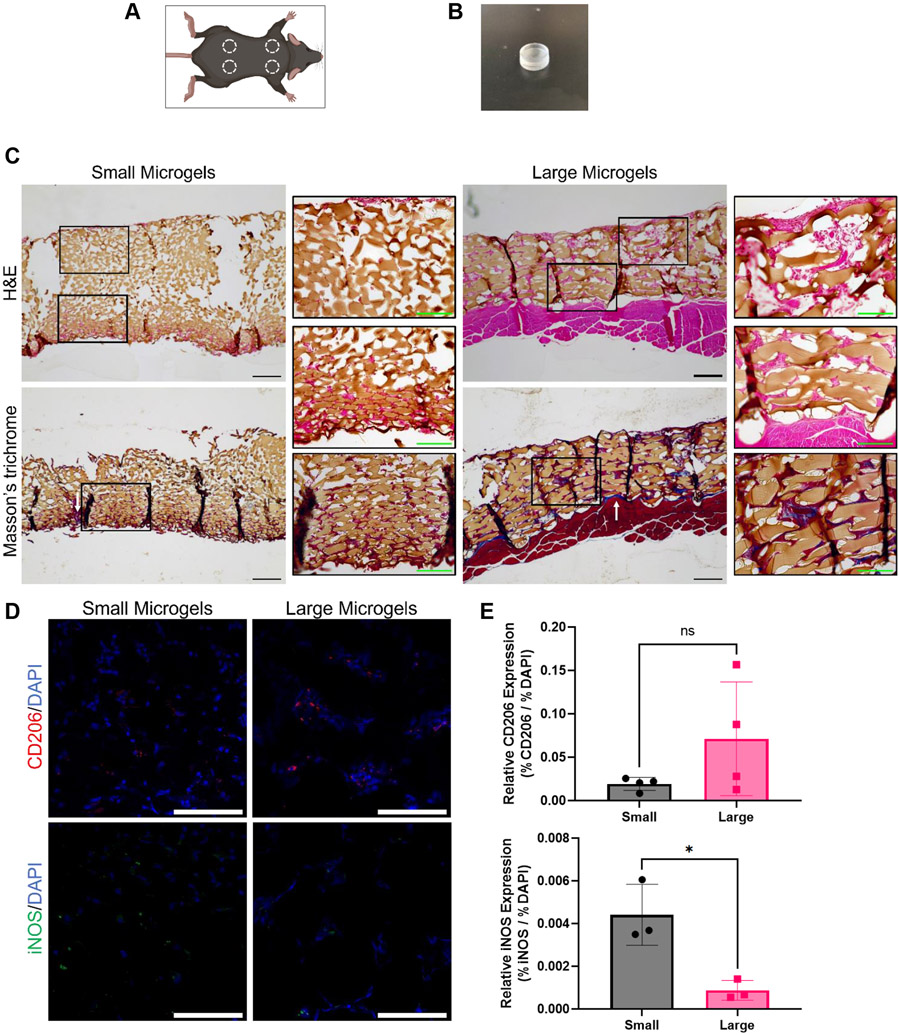
Subfascial implantation of microgel scaffolds. A) Microgel scaffolds were implanted in four locations per mouse. B) PDMS mold that was loaded with microgels and implanted. C) H&E and Masson’s trichrome staining illustrate greater cell infiltration into large microgel scaffolds. Fibrous tissue is sometimes present at the microgel interface (white arrows). Primary scale bars represent 200 μm. Inset scale bars represent 100 μm. D,E) IHC reveals a correlation between microgel diameter and macrophage phenotype. Scale bars represent 100 μm. Statistics: Unpaired Student’s t tests. n ≥3. *p < 0.05.

