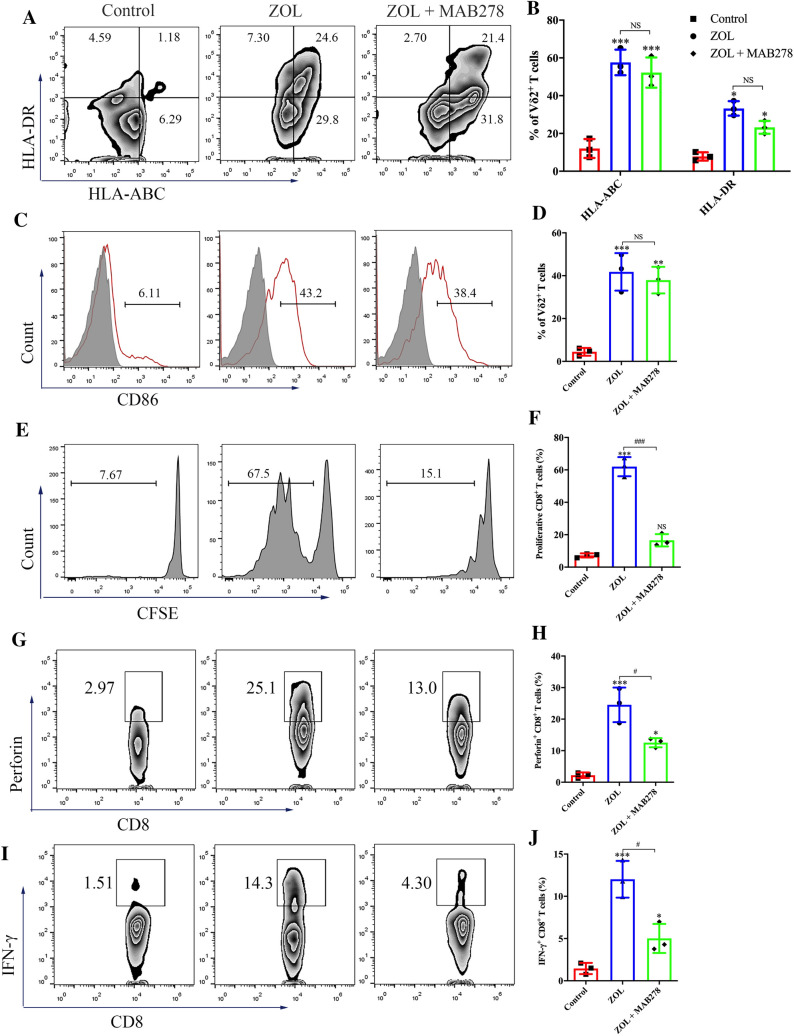
Fig. 7.
CCL5 promotes the antigen presentation function of γδ T cells. A–D Resting γδ T cells were treated with ZOL or ZOL plus CCL5 blocking antibody MAB278 (ZOL + MAB278) for 3 days. A, B) The expression levels of MHC molecules on γδ T cells were measured using flow cytometry. C, D The expression levels of CD86 on γδ T cells were measured using flow cytometry. E, F Resting γδ T cells were treated with ZOL or ZOL + MAB278 for 7 days before MAGEA3 incubation. Then, the γδ T cells were washed and co-cultured with CFSE-labeled CD8+ T cells for 10 days at an APC/responder cell ratio of 1:10. Proliferating CFSE− CD8+ T cells were measured by flow cytometry. G–J Resting γδ T cells were treated with ZOL or ZOL + MAB278 for 7 days before MAGEA3 incubation. Then, the γδ T cells were washed and co-cultured with CD8+ T cells for 7 days at an APC/responder cell ratio of 1:10. After that, the cells in each group received the same stimulation as the previous one for 4 h followed by further analysis. G, H Perforin expression levels in CD8+ T cells were measured by flow cytometry. I, J IFN-γ expression levels in CD8+ T cells were measured by flow cytometry. Representative data were shown from 2 to 3 independent experiments. All the values were presented as mean ± SD. *p < 0.05, **p < 0.01, ***p < 0.001 versus Control, #p < 0.05, ###p < 0.001. NS, not significant

