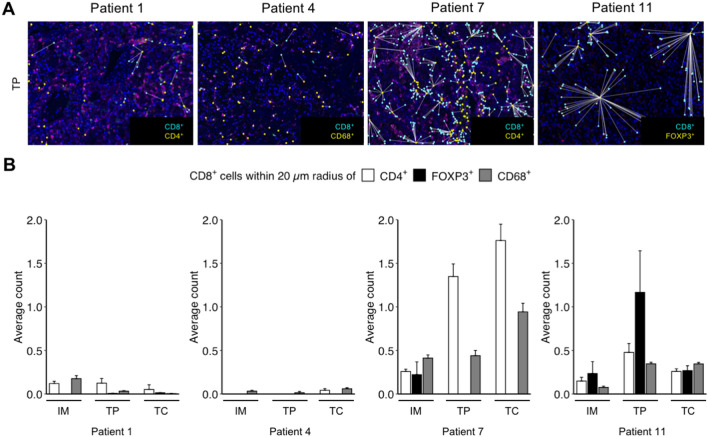
Fig. 7.
Heterogeneity of immune cell populations in the CD8 + TIL microenvironment in ccRCC. Representative microphotographs of a multiplex immunofluoresence staining for the markers indicated. White lines indicate the nearest immune cell neighbor for each CD8 + TIL. Scale bar = 250 μm (A). Quantification of the number of CD8 + TILs within a 20 μm radius of CD4 + , FOXP3 + or CD68 + immune cells for four ccRCC patients with different mutational patterns. Each bar represents mean and standard error of CD8 + cells obtained from three images analyzed for the different tumor regions with the exception of patient 11, where two images per region were analyzed. IM, invasive margin; TP, tumor periphery; TC, tumor center (B)

