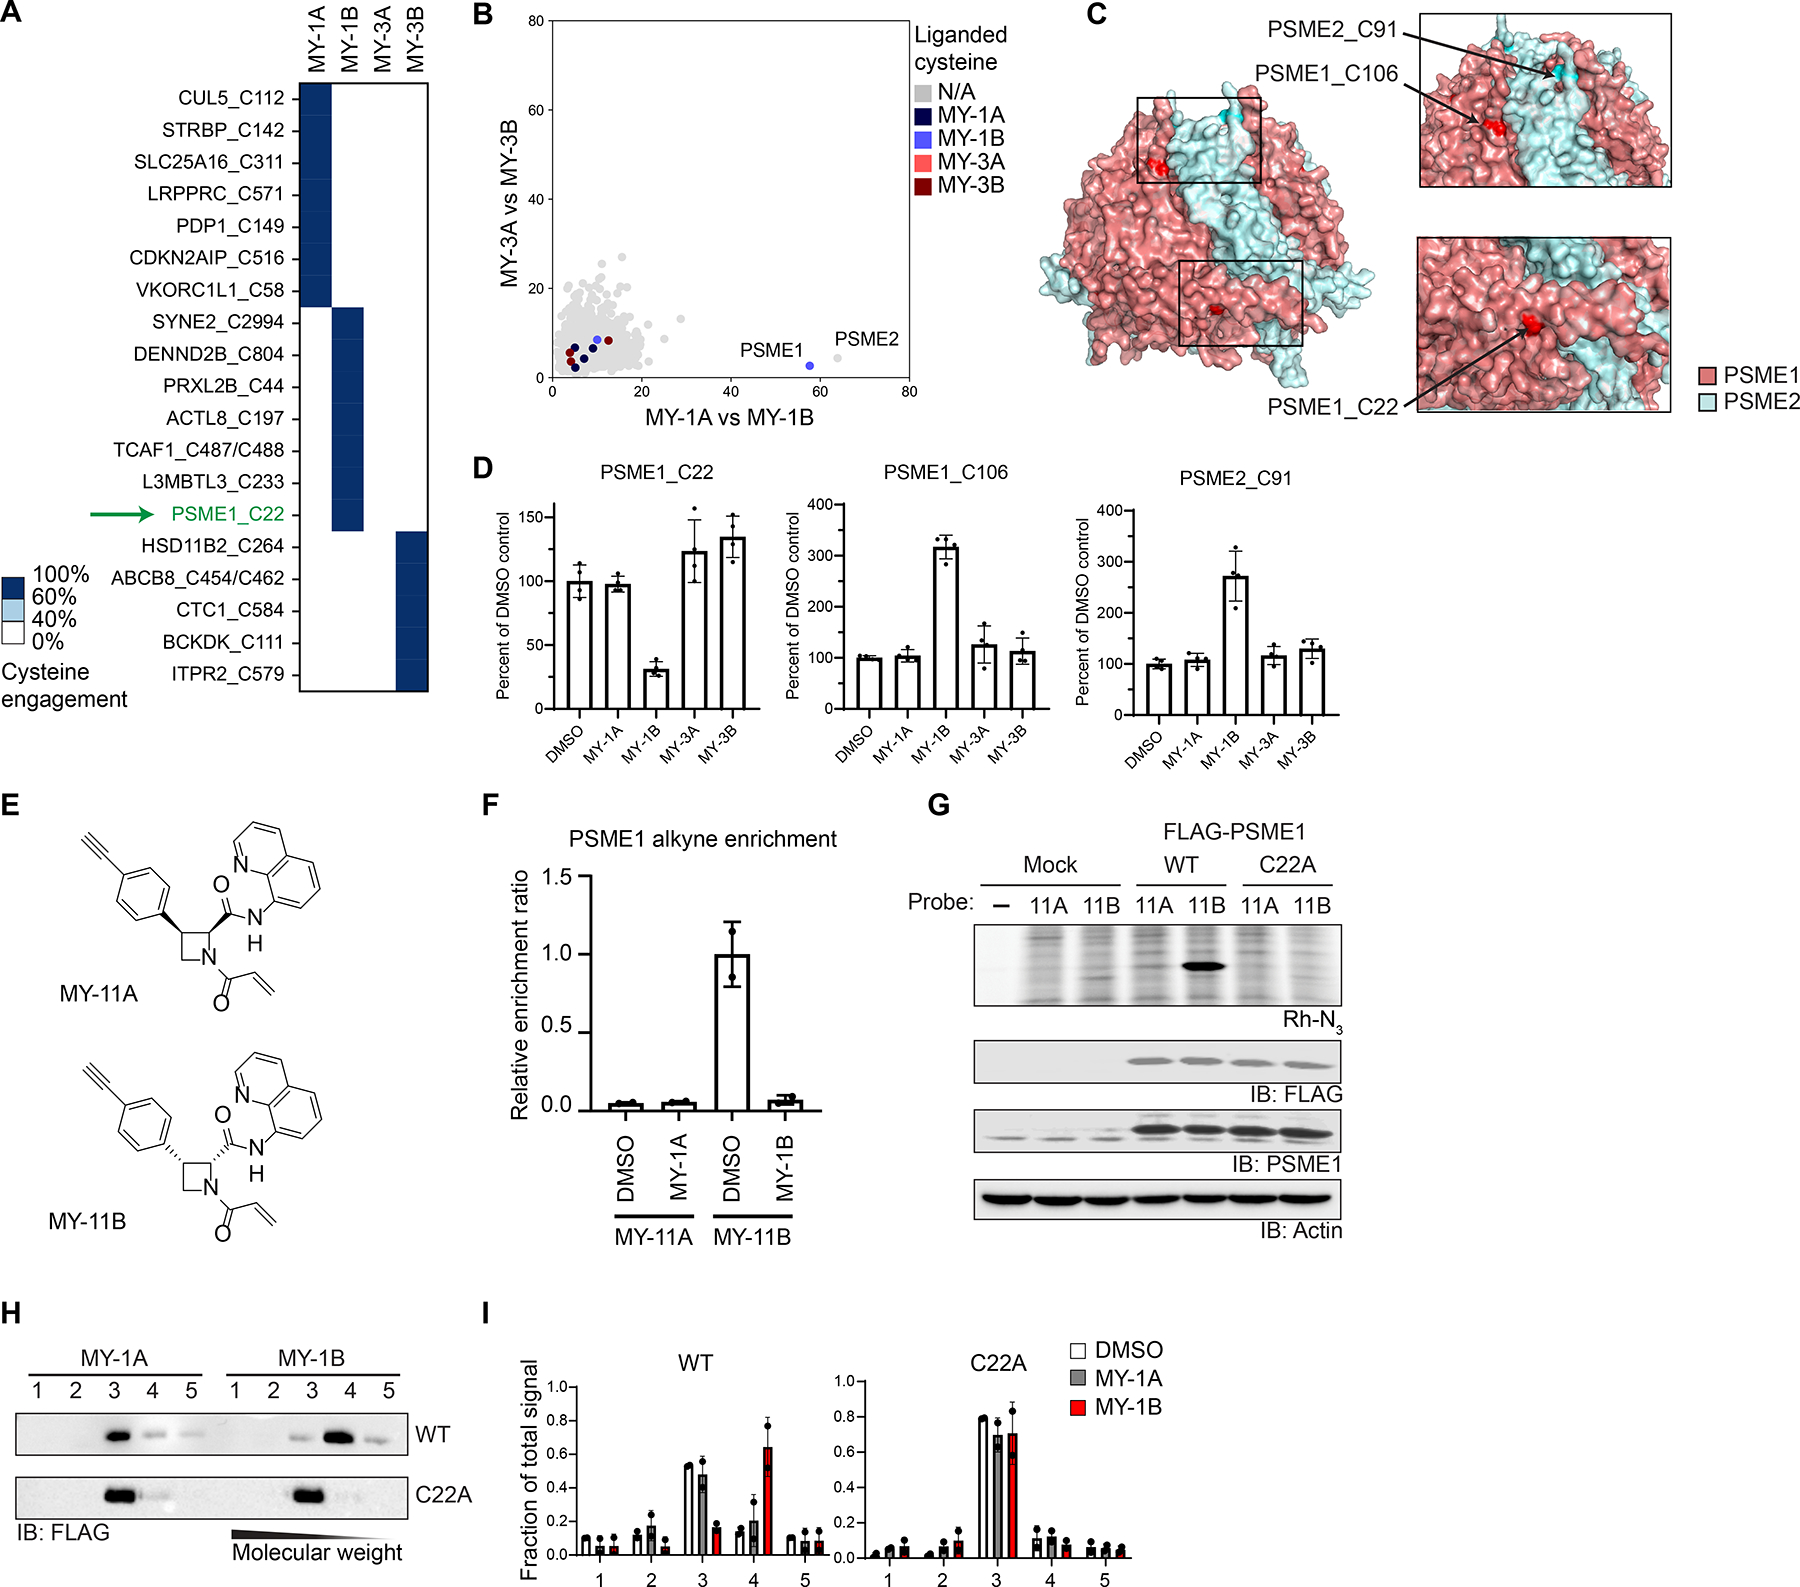
Figure 2.

Electrophilic compounds disrupt the PA28 complex by engaging C22 of PSME1. A. Heatmap showing cysteines stereoselectively liganded by azetidine acrylamides in 22Rv1 cells (20 μM compound, 1 h) as determined by cysteine-directed ABPP. Cysteines were considered stereoselectively liganded if they showed > 60% reduction in IA-DTB labeling by one stereoisomeric compound and < 40% reduction for the other three stereoisomeric compounds. Data are average values from n = 4 independent experiments.
B. Graph showing size shifts of proteins in pairwise comparisons of SEC profiles for 22Rv1 cells treated with azetidine acrylamide enantiomers (MY-1A vs MY-1B, x-axis; MY-3A vs MY-3B; y-axis; reanalysis of data from Figure 1E), where proteins with stereoselectively liganded cysteines are color-coded.
C. Crystal structure of PSME1 and PSME2 complex (PDB: 7DRW).
D. Reactivity of cysteines in PSME1 and PSME2 quantified in cysteine-directed ABPP experiments.
E. Structures of alkynylated azetidine acrylamide probes MY-11A (inactive) and MY-11B (active).
F. Quantification of stereoselective enrichment of PSME1 by MY-11B (5 μM, 1 h) compared to MY-11A (5 μM, 1 h) and blockade of enrichment by MY-1A and MY-1B (20 μM, 2 h pretreatment) in Ramos cells. Data are average values ± SD normalized to MY-11B treatment group, n = 2 independent experiments.
G. MY-11B, but not MY-11A (2. 5 μM 30 min), reacts with recombinantly expressed WT-PSME1, but not a C22A-PSME1 mutant expressed in HEK293T cells as determined by gel-ABPP. Top image, ABPP data (top image); bottom images, western blots. Results are from a single experiment representative of two independent experiments.
H. Western blot analysis of SEC profiles for recombinant WT and C22A-PSME1 expressed in 22Rv1 cells treated with MY-1A or MY-1B (10 μM, 3 h) prior to analysis by SEC.
I. Quantification of data shown in panel H. Data are average values ± SD from n = 2 independent experiments.
