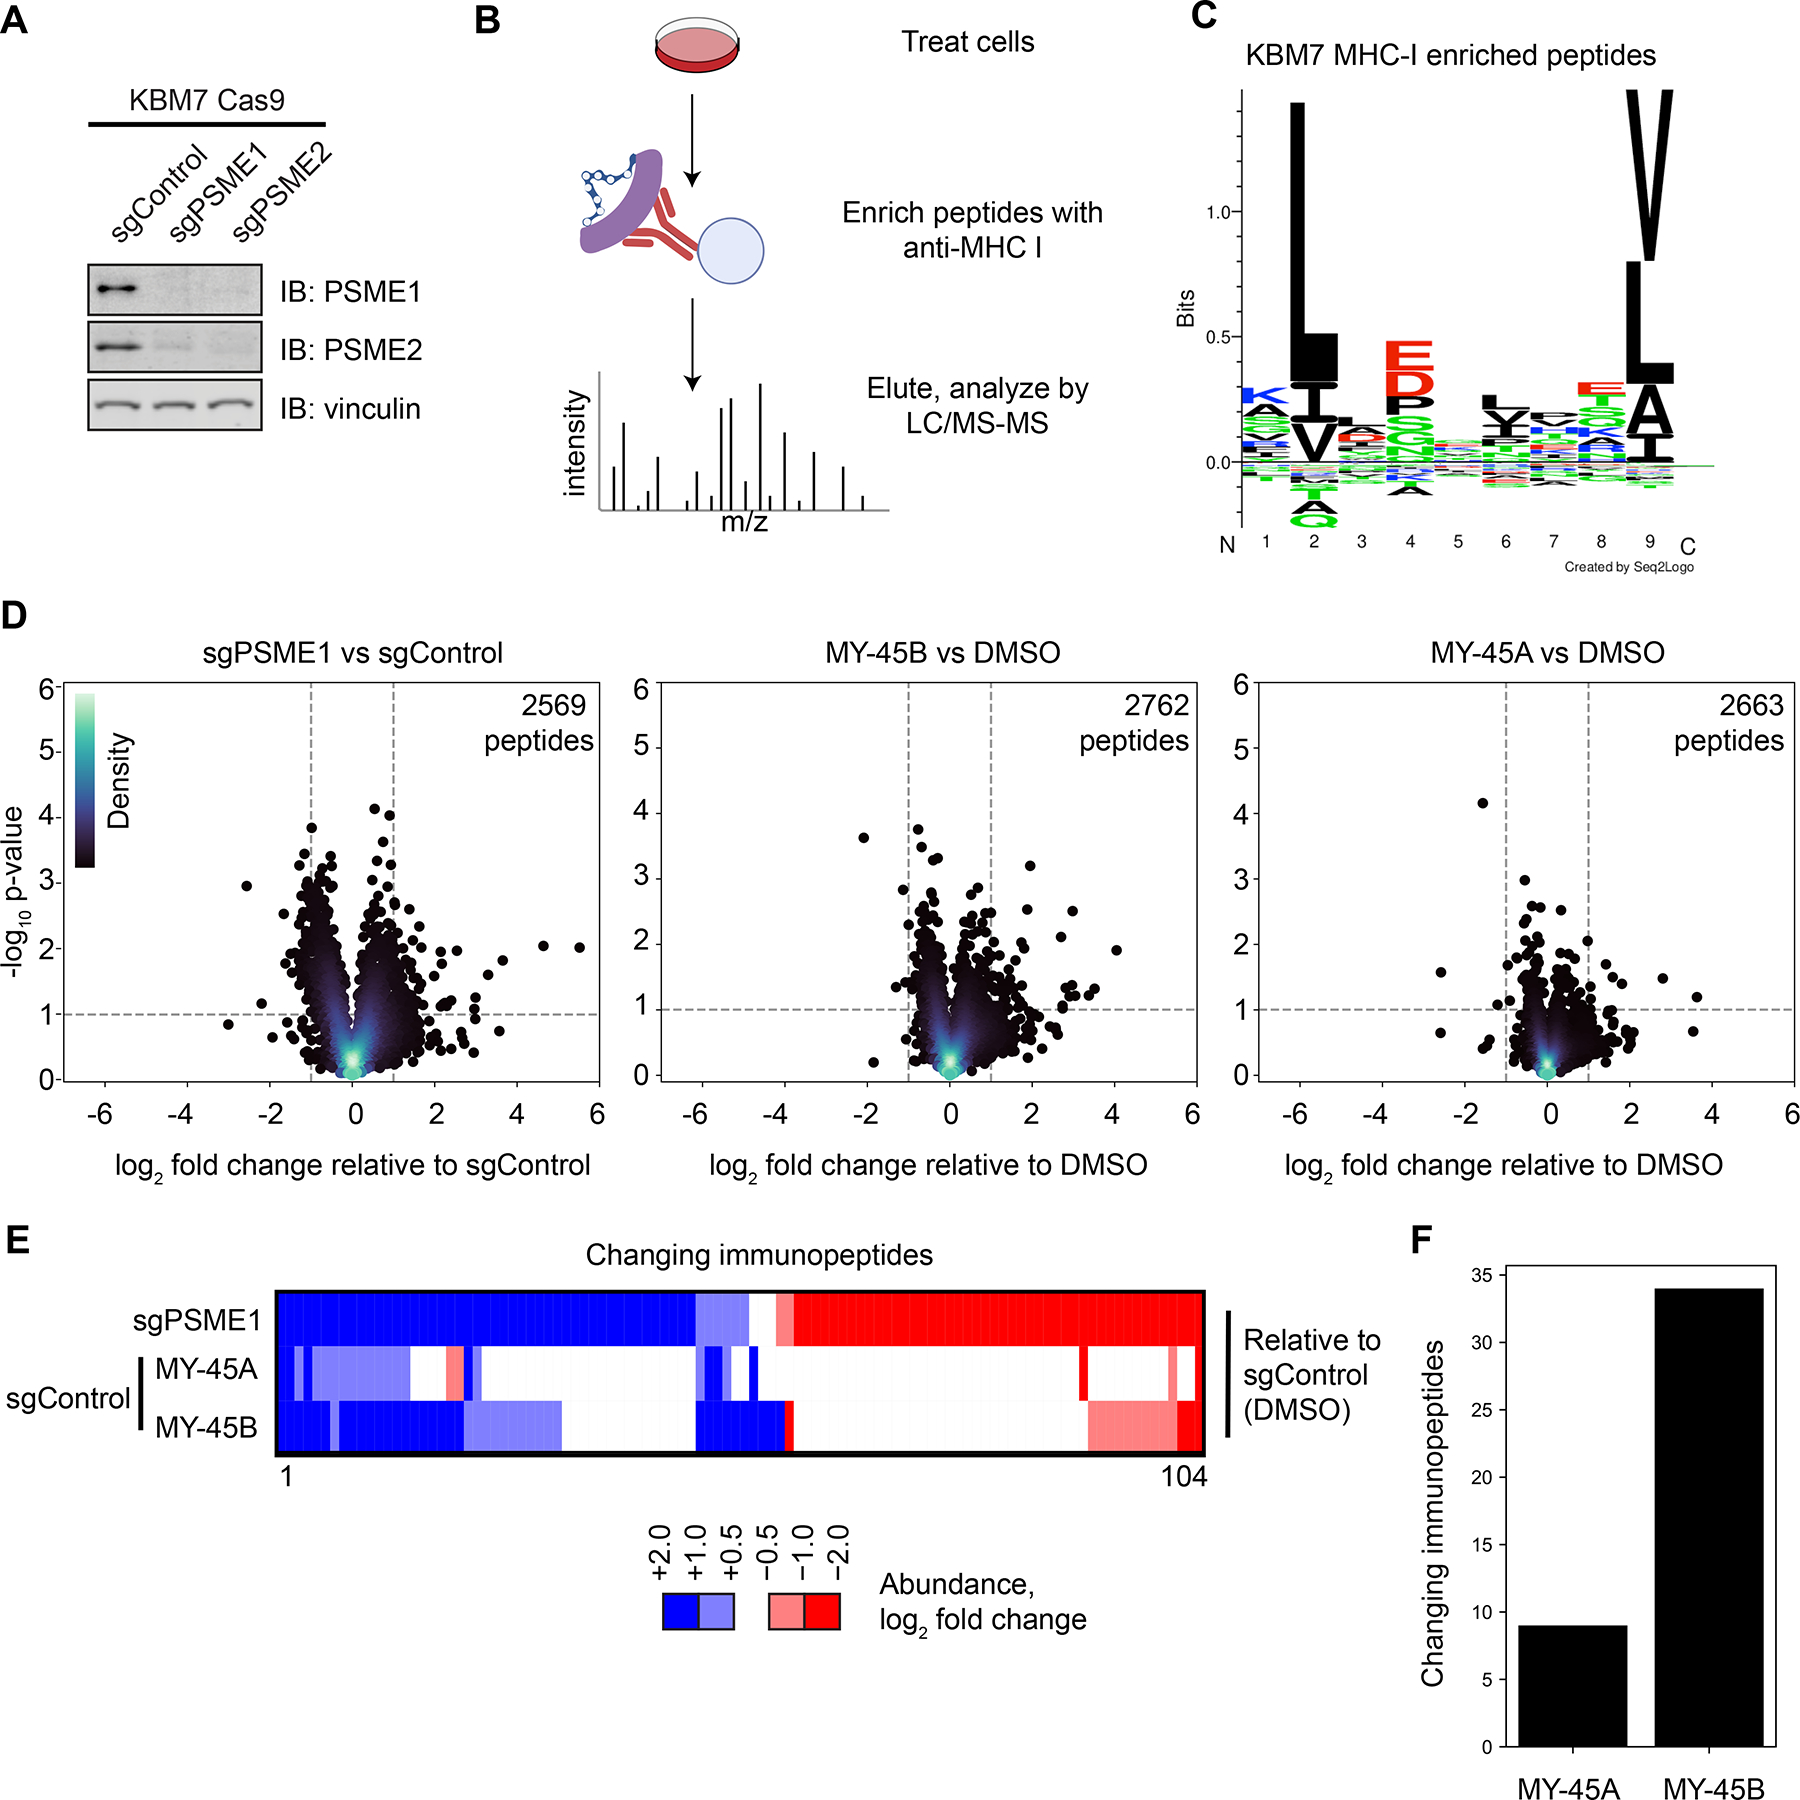
Figure 4.

Chemical or genetic perturbation of PSME1 modulates MHC-I-immunopeptide interactions in human leukemia cells. A. Western blots of PSME1 and PSME2 in KBM7 CRISPR/Cas9 control (sgAAVS1), PSME1 (sgPSME1), or PSME2 (sgPSME2) cell lines. Results are from a single experiment representative of two independent experiments.
B. Cartoon schematic for anti-MHC class I immunopeptidomics protocol. After compound treatment, cells are lysed, and MHC-I bound peptides immunoprecipitated with anti-MHC-I antibody, eluted, and analyzed by LC-MS.
C. Motif analysis of peptides enriched by MHC-I co-immunoprecipitation from KBM7 cells.
D. Volcano plots showing substantially (> two-fold increase or decrease) and significantly (p value < 0.05) changing MHC-I bound immunopeptides in sgPSME1 vs sgControl (sgAAVS1) cells (left), DMSO- vs MY-45B-treated sgControl cells (middle), or DMSO- vs MY-45A-treated sgControl cells (right) (10 μM compound, 8 h). Data are average values from n= 3–4 independent experiments.
E. Heatmap of MHC-I-bound immunopeptides that are substantially and significantly changing in at least one comparison group (sgPSME1 vs sgControl; MY-45A- vs DMSO-treated sgControl; or MY-45B- vs DMSO-treated sgControl) as defined in panel D.
F. Bar graph showing the number of MHC-I-bound immunopeptides that are substantially and significantly changing in MY-45A- vs DMSO-treated sgControl or MY-45B- vs DMSO-treated sgControl cells as defined in panel D.
