
Figure 7.
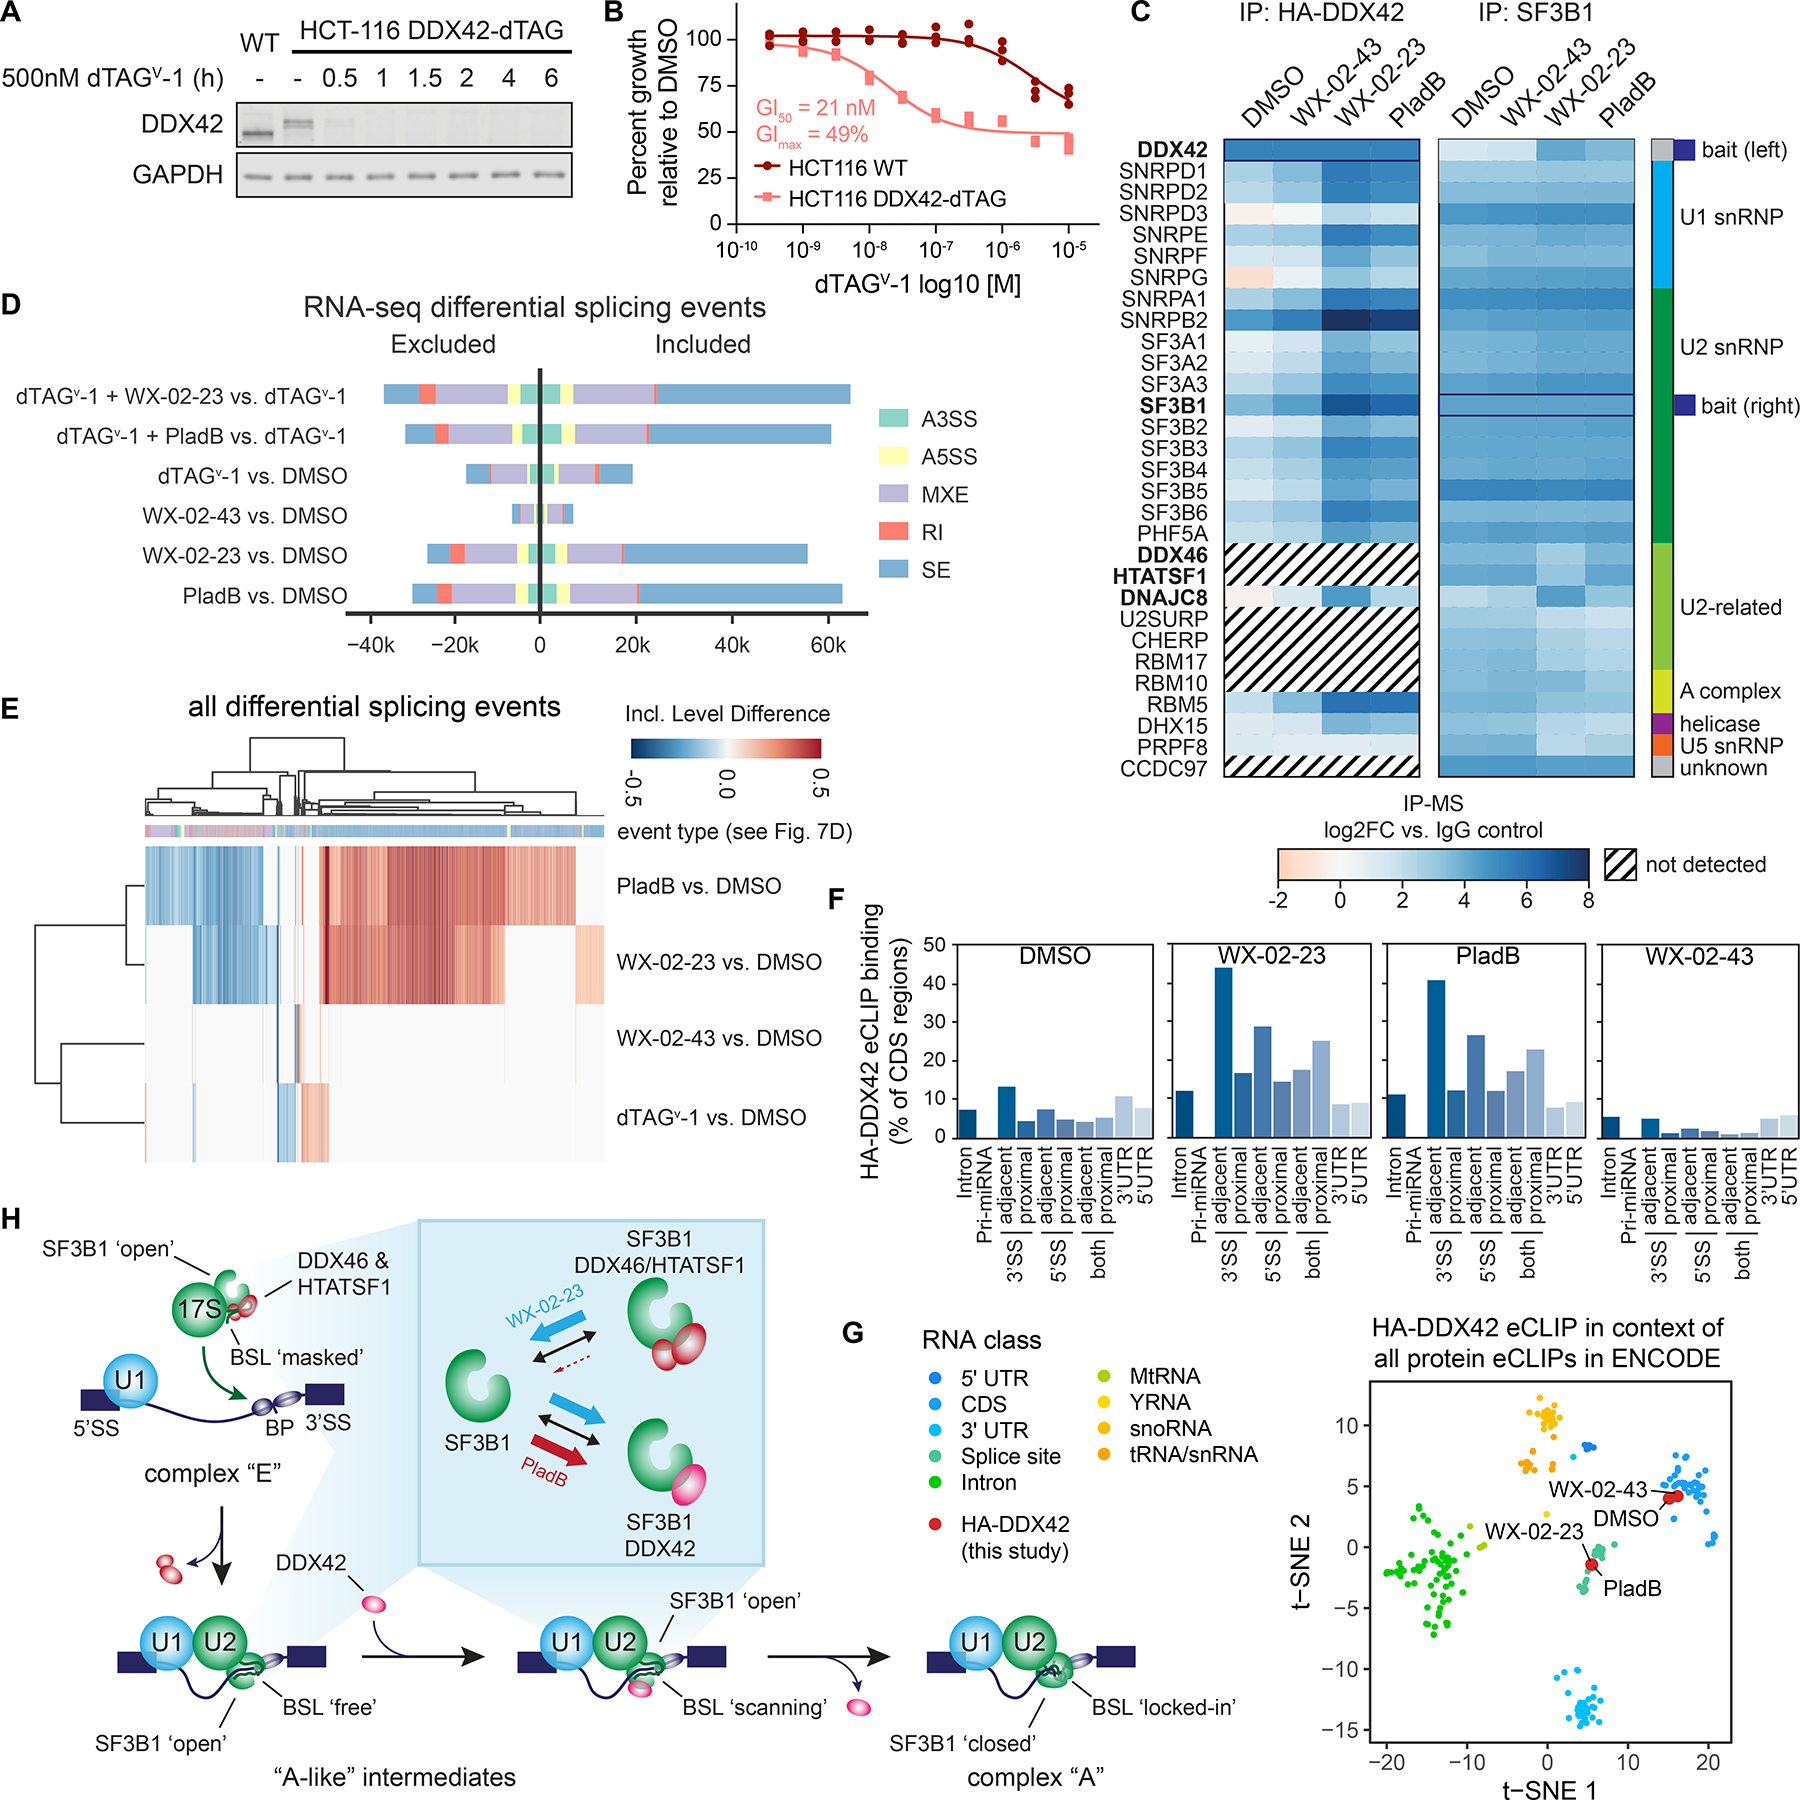
DDX42 facilitates spliceosome branch point selection. A. Western blot analysis of dTAGv-1 ligand-induced DDX42 degradation in DDX42-dTAG HCT-116 cells.
B. Cell growth curves for DDX42-dTAG or wild-type HCT-116 cells treated with dTAGv-1 for 72 h. Data are from n = 3 independent experiments.
C. Heatmap showing proteins enriched in HA-DDX42 (left) or SF3B1 (right) immunoprecipitation-MS experiments in DDX42-dTAG HCT-116 cells treated with WX-02-23 (5 μM), WX-02-43 (5 μM), pladienolide B (PladB, 10 nM), or DMSO for 3 h. Proteins were included if they were either enriched in DMSO vs. IgG (log2FC >1 for HA,
>2 for SF3B1) or in WX-02-23 vs. DMSO (log2FC >2). Results are average values from 2–4 independent experiments. Interacting proteins were input into the StringDB database and the largest connected component of 30 proteins form the basis of the heatmap. Data were normalized to corresponding bait and are shown as log2 fold-enrichment vs. IgG control. Diagonal black lines indicate proteins that were not detected in HA-DDX42 IP-MS experiments. Bold type mark proteins substantially affected in interactions with SF3B1 by WX-02-23 and/or pladienolide B.
D. Alternative splicing events triggered by indicated combinations of DDX42 degradation +/− treatment with pladienolide B (PladB, 10 nM), WX-02-23 (5 μM) or WX-02-43 (5 μM) in DDX42-dTAG HCT-116 cells. Cells were pre-treated for 1 h with either 500 nM dTAGv-1 or DMSO, followed by addition of either DMSO or compounds for 8 h. Splicing changes were identified with rMATS threshold of |PSI| > 0.1 and FDR < 0.05. Data represent values from three independent experiments.
E. Clustered heatmap of inclusion level differences between indicated compound treatments and DMSO control for alternative splicing events from panel D. Columns are annotated by the type of alternative splicing event in the color scheme of panel D. Data represent values from three independent experiments.
F. DDX42 RNA-binding profiles in DMSO- vs compound-treated DDX42-dTAG HCT-116 cells measured by eCLIP-seq using the HA-tag of the dTAG fusion. DDX42-dTAG HCT-116 cells were treated with WX-02-23 (5 μM), WX-02-43 (5 μM), or Pladienolide B (100 nM) for 3 h. Data are average values from two independent experiments. eCLIP enriched windows (FDR<0.2) w are depicted as percent binding relative to coding sequence (CDS). Proximal denotes within 500 bases and adjacent denotes within 100 bases from the annotated splice site (SS).
G. tSNE of HA-DDX42 eCLIP samples in the context of all available eCLIP datasets that were generated by the ENCODE consortium. DDX42-dTAG HCT-116 cells were treated with WX-02-23 (5 μM), WX-02-43 (5 μM), or Pladienolide B (100 nM) for 3 h. Data are average values from n = 2 independent experiments.
H. Proposed model for function of DDX42 in facilitating the branch point selection step of spliceosome function. Inset summarizes differential SF3B1 complexation effects caused by synthetic, covalent (WX-02-23) vs natural product, reversible (pladienolide B) SF3B1 ligands.