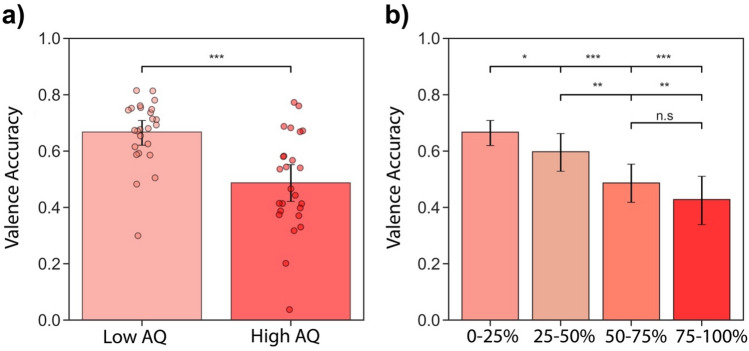
Figure 6.
IET valence accuracy across different ranges of AQ scores for the best videos. (a) IET valence accuracy for low AQ scores (AQ < 18, n = 51) and high AQ scores (AQ > 18, n = 51). Each dot represents an individual participant. (b) IET accuracy as function of AQ quartiles: 0–25% AQ scores (9–16 AQ, n = 25), 25–50% AQ scores (16–18, AQ, n = 25), 50–75% AQ scores (18–22, AQ, n = 25), 75–100% AQ scores (22–33 AQ, n = 27). Error bars represent bootstrapped 95% CI.

