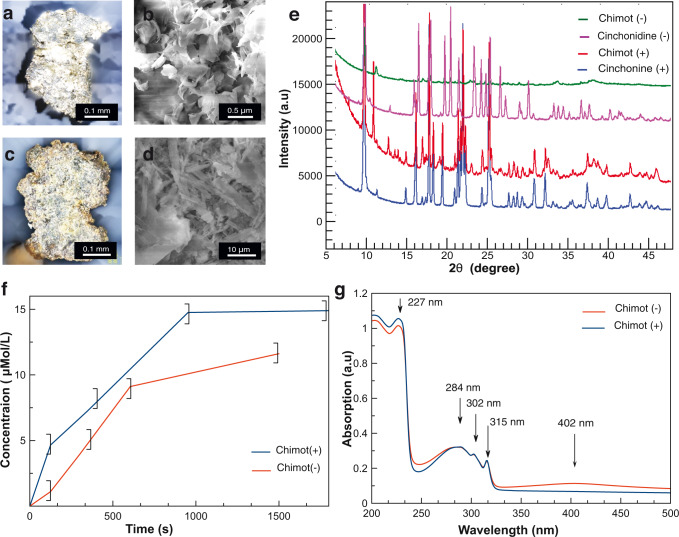
Fig. 2. Microscopy and spectroscopy characterization of chimots.
a–d Laser confocal microscopy and scanning electron microscopy images of representative (a, b) chimot+ and (c, d) chimot−. e X-ray diffraction patterns of reference pure organic samples (blue and pink) and corresponding Ag–cin complexes (red, green) suggest the coexistence of at least two separate phases in the chimot particles. f Time-dependent concentration changes of cinchona alkaloids, determined by UV–Vis spectroscopy of the water–air interface, during swimming of the chimots (evaluated for λ = 315 nm). g UV–Vis spectra of the water, taken after the rotation, show full consistency with literature spectra of these alkaloids (main absorbance bands are indicated).

