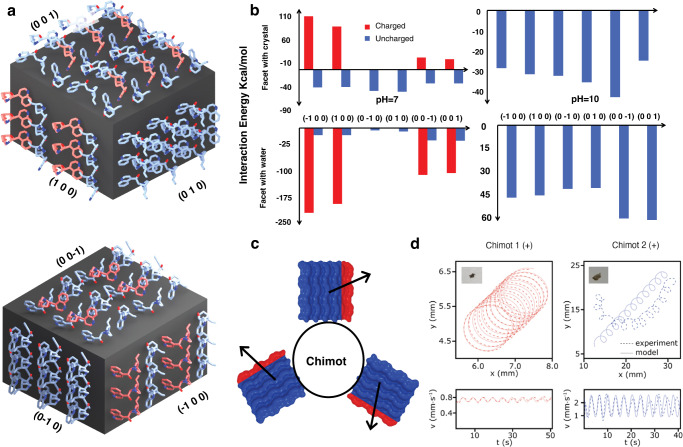
Fig. 3. Model and simulations.
a Visualization of cinchonidine crystals with each facet labeled by Miller indices. Red molecules indicate a positive charge at pH = 7. Blue molecules indicate a neutral charge at pH = 7. b Interaction energy of facet-embedded cin molecules with water (bottom) and the bulk cin crystal (top), calculated with the NAMDEnergy plugin. At pH = 7 (left) and 10 (right), uncharged molecules exhibit weak attractive interaction energies with water, and stronger attractive interaction energies with the crystal, indicating their retention in the facet. At pH = 7, charged molecules exhibit strong, attractive interaction energies with water and strong repulsive interaction energies with the crystal, indicating their ejection from the facet. Under both conditions, there is a preference for which facets are most likely to maximize exposure to water. In addition, there is an asymmetry between opposing facets’ release of molecules from the surface. c Schematic showing the adsorption of cin crystals to the chimot and the rotation-driving dynamics emerging from the chiral symmetry of the crystallite. d Comparison between experimental (dashed lines) and a Stokesian hydrodynamic rotation model (solid lines) for two different particles.

