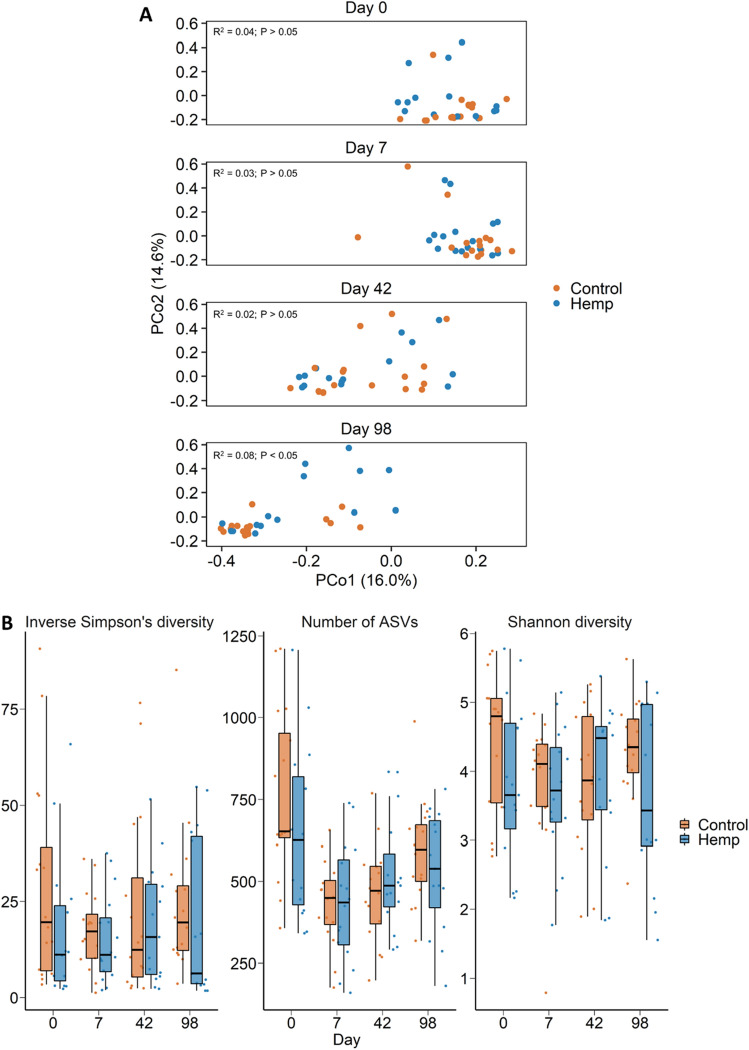
Figure 4.
(A) Principal coordinates analysis (PCoA) plot of the Bray–Curtis dissimilarities for the nasopharyngeal microbiota by diet and sampling day. The PERMANOVA results for the effect of diet within each day is included on each plot. The percentage of variation explained by each principal coordinate is indicated on the axes; (B) Box and whisker plot of the number of ASVs and the Shannon and inverse Simpson’s diversity indices for the nasopharyngeal microbiota by sampling day and diet. The box indicates the interquartile range (IQR) (middle 50% of the data), the middle line represents the median value, and the whiskers represents 1.5 times the IQR; Control refers to the group of heifers that received 20% DDGS in their diet (n = 15) and Hemp refers to the group that received 20% hempseed cake inclusion diet (n = 16).

