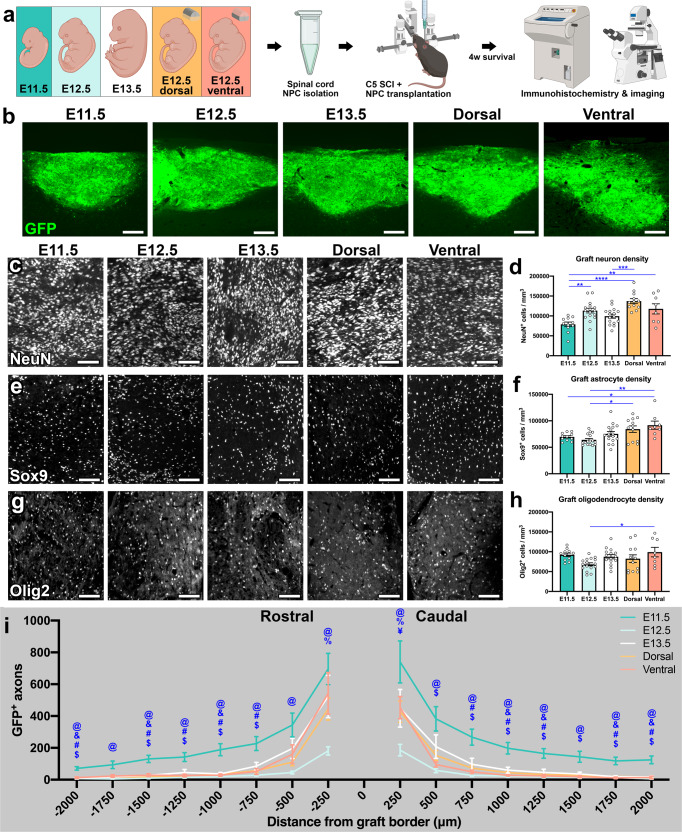
Fig. 2. Developmental stage of donor NPCs does not substantially affect neurogenesis or gliogenesis, but earlier-stage grafts exhibit enhanced axon outgrowth.
a Experimental design for the data presented in Figs. 2, 3, 5, and S1. Whole embryonic spinal cords were obtained from E11.5, E12.5, and E13.5 GFP+ mouse embryos, and NPCs were isolated from spinal cord tissue. Additional E12.5 spinal cords were subjected to dorsal/ventral dissection isolated prior to NPC isolation. Four weeks following NPC transplantation into cervical (C5) SCI, tissue was collected for immunohistochemical analysis. Illustration created with BioRender.com. b Representative images of GFP+ grafts. c, e, g Representative images showing the distributions of c NeuN+ neurons, e Sox9+ astrocytes, and g Olig2+ oligodendrocytes in grafts. d, f, h Quantification of d graft neuron density, f graft astrocyte density, and h graft oligodendrocyte density. *P < 0.05, **P < 0.01, ***P < 0.001, ****P < 0.0001 by one-way ANOVA + Tukey’s multiple comparisons test. i Quantification of graft-derived GFP+ axon outgrowth at 250-μm intervals rostral and caudal to the graft. Statistical significance for panel i is indicated by the following symbols: @ P < 0.05 for E11.5 vs. E12.5; & P < 0.05 for E11.5 vs. E13.5; # P < 0.05 for E11.5 vs. dorsal; $ P < 0.05 for E11.5 vs. ventral; % P < 0.05 for E12.5 vs. dorsal; ¥ P < 0.05 for E12.5 vs. ventral by two-way repeated measures ANOVA with Tukey’s multiple comparisons test. All data are mean ± SEM. E11.5 (n = 11); E12.5 (n = 16); E13.5 (n = 16 in d, f, i; n = 15 in h); dorsal (n = 12); ventral (n = 8). Scale bars = 200 μm (b), 100 μm (c, e, g). Source data are provided as a Source Data file. The experiments in panels b, c, e, and g were performed twice with similar results.

