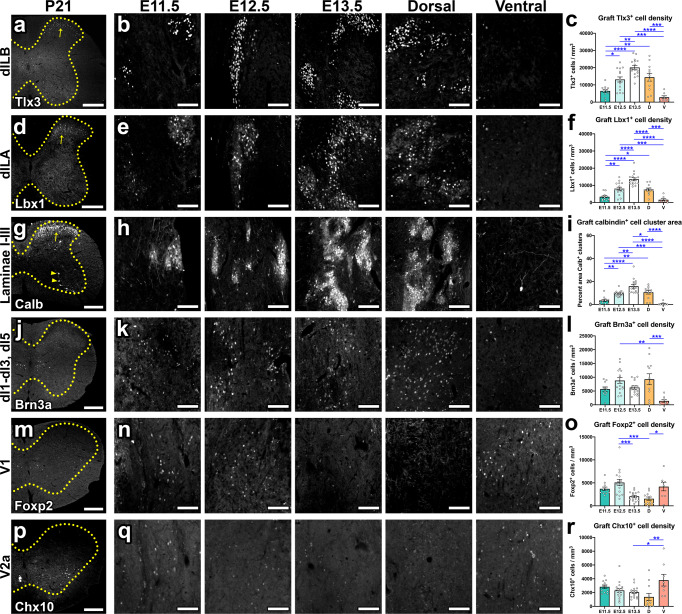
Fig. 3. Developmental stage of donor NPCs significantly influences graft neuronal subtype composition.
a, d, g, j, m, p Distribution of cell type-specific markers in intact P21 mouse spinal cord. b, e, h, k, n, q Images of NPC grafts at 4 weeks post-transplantation into sites of cervical SCI. Images within the same column in rows b and e, as well as rows n and q, are different fluorescent channels of the same tissue section. c, f, i, l, o, r Quantification of the abundance of c Tlx3+, f Lbx1+, i clustered calbindin+, l Brn3a+, o Foxp2+, and r Chx10+ interneurons in NPC grafts. e Note the different populations of clustered calbindin+ neurons (arrow) and non-clustered, larger calbindin+ neurons (arrowheads). *P < 0.05, **P < 0.01, ***P < 0.001, ****P < 0.0001 by one-way ANOVA with Tukey’s multiple comparisons test. E11.5 (n = 11); E12.5 (n = 16); E13.5 (n = 16); dorsal (n = 12); ventral (n = 8). All data are mean ± SEM. Scale bars = 250 μm (a, d, g, j, m, p); 100 μm (b, e, h, k, n, q). Source data are provided as a Source Data file. The experiments in panels a, b, d, e, g, h, j, k, m, n, p, and q were performed twice with similar results.

