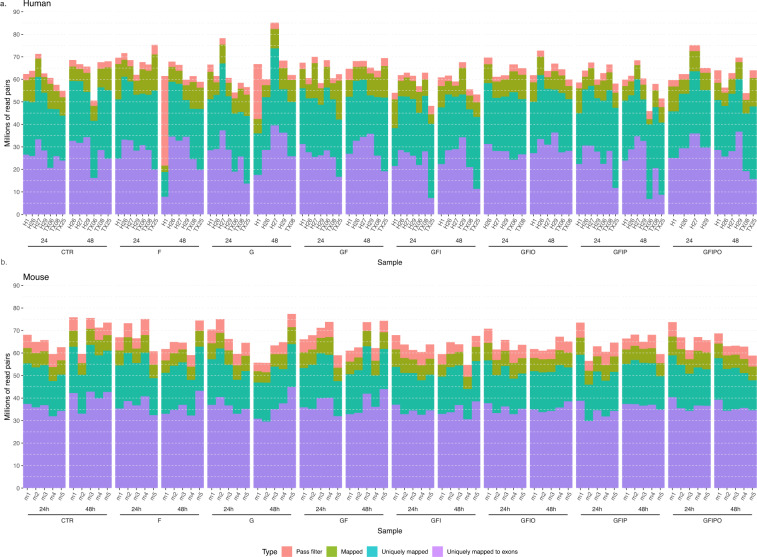
Fig. 2.
Sequencing metrics from RNASeq data analysis. Number of reads per human (a) and mouse (b) sample according to quality metrics from the analysis pipeline. Each column bar shows the cumulative number of reads that map (1) uniquely to coding regions (uniquely mapped to exon), (2) uniquely to any region (uniquely mapped), (3) map to genome including ambiguous mappings (map), and (4) that passed the quality control filter (Pass filter).

