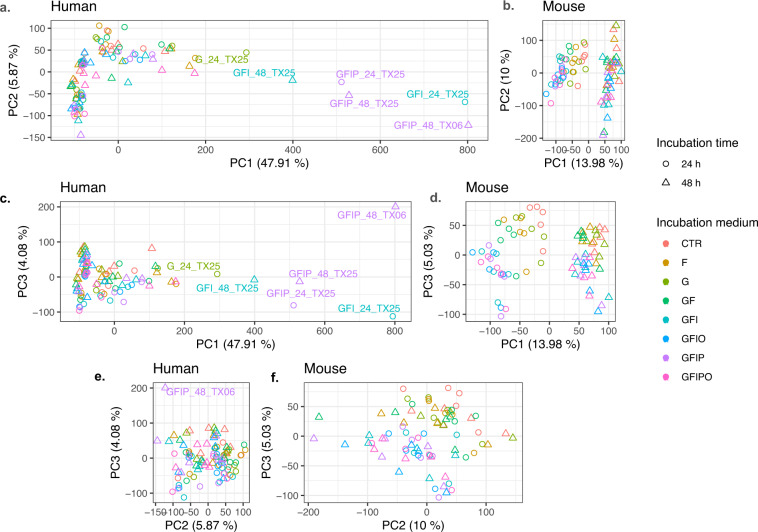
Fig. 3.
Principal Component Analysis. Scatter plot with of 1st principal component (PC) vs. 2nd PC (a,b), 1st vs. 3rd (c,d) and 2nd vs. 3rd (e,f) for human (a,c,e) and mouse (b,d,f) samples. Different symbol shapes indicate different timepoints i.e. circles for 24 h and triangles for 48 h. Different colors indicate the different conditions. All plots have the same height and 1:1 scale of both axes, aspect ratio of individual plot is determined by relative spread across the two principal components.

