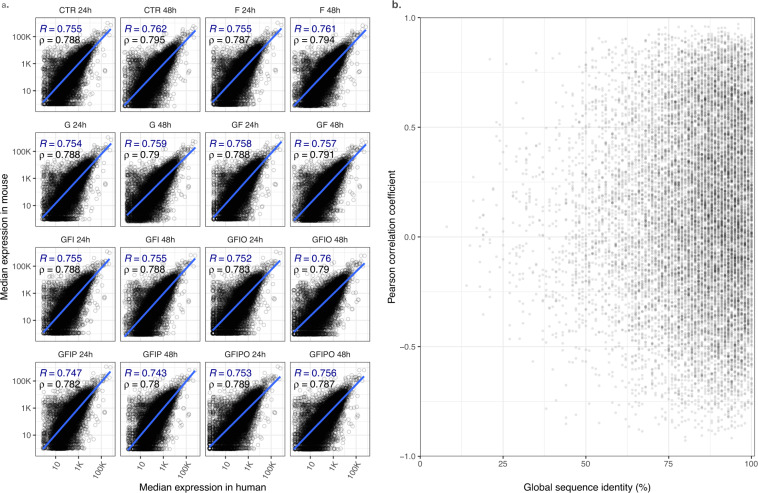
Fig. 5.
Human vs. mouse gene expression correlation. Human vs. mouse gene expression correlation. (a) Correlation of mouse vs. orthologous human gene expression (log-scale) per sample condition. All mouse genes with their defined next human ortholog have been included. The blue line and coefficient show log-linear correlation line based on Pearson’s R while the black coefficient shows the correlation coefficient based on Spearman’s coefficient. (b) Scatter plot of expression correlation coefficient vs. the global sequence identity for all pairs of homologous genes.

