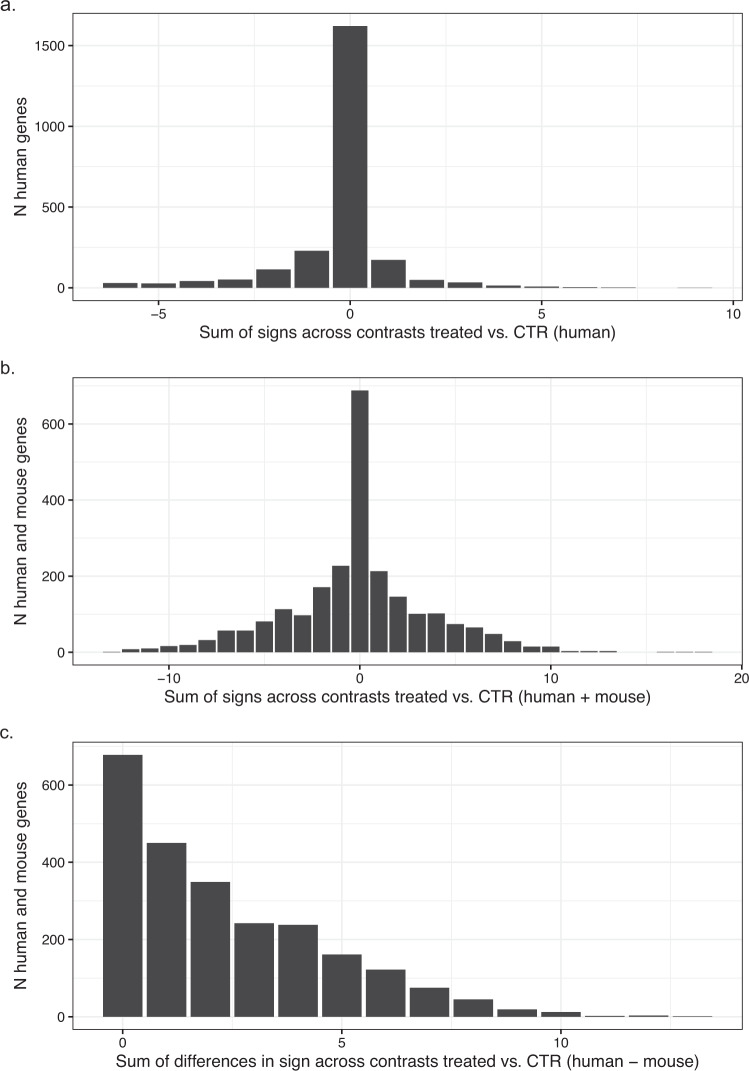
Fig. 6.
Top regulated genes based on experimental design. Top regulated genes based on experimental design. For each nutrient supplementation condition, the differential expression contrast was calculated using the expression with nutrient supplementation as test condition vs. time matched baseline condition as the control condition (e.g. Glucose vs. CTR at 24 h). The three histograms show the integrated distribution across all contrasts i.e. number of genes by (a) sum of signs across the all 14 human contrasts; (b) sum of signs in the combined 28 human + mouse contrasts; and c. the sum of absolute differences in signs of the human vs. the corresponding mouse contrast. For a given contrast, a gene is considered as being differentially expressed vs. control condition if |log-ratio| ≥0.5 and padj ≤0.05. The integrated sum of sign is calculated by counting up-regulated conditions as 1 and down-regulated condition as −1. Maximum and minimum sums correspond to +14 and −14 per species (a), +28 and −28 for the combined experiment (b) and 0, 28 for the sum of different signs, respectively.

