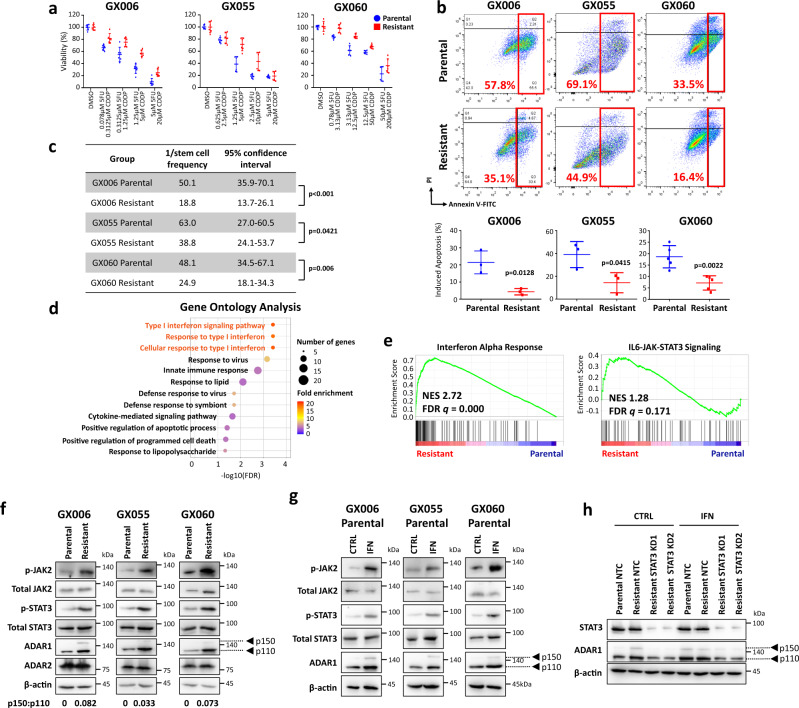
Fig. 1. 5FU + CDDP drug resistant gastric organoids exhibit interferon/JAK/STAT signaling activation leading to induction of ADAR1 expression.
GC patient-derived organoids of intestinal subtype GX006, GX055 and GX060 were trained with increasing concentrations of 5-fluorouracil (5FU) and cisplatin (CDDP) combination to develop 5FU + CDDP resistant lines. a CellTiter-Glo analysis showing the viability of parental versus 5FU + CDDP resistant organoids following treatment in various concentrations of 5FU + CDDP combinations. b Annexin V-PI analysis showing the percentage of apoptotic cells in parental versus 5FU + CDDP resistant organoids following treatment in 1.25 µM 5FU + 5 µM CDDP (GX006) or 5 µM 5FU + 20 µM CDDP (GX055 and GX060). c In vitro limiting dilution spheroid formation and tumor-initiating cell frequency calculation in parental versus 5FU + CDDP resistant organoids. d, e Gene Ontology (GO) (d) and Gene Set Enrichment Analysis (GSEA) (e) of differentially expressed genes identified by RNA-seq data found enrichment of interferon signaling and its downstream JAK/STAT signaling in the 5FU + CDDP resistant organoids as compared to parental controls. f Western blot for phosphorylated and total JAK2, phosphorylated and total STAT3, ADAR1 and ADAR2 in the three paired parental and 5FU + CDDP resistant organoid lines. β-actin served as a loading control. g Western blot for phosphorylated and total JAK2, phosphorylated and total STAT3 and ADAR1 in the three parental organoid lines with or without interferon (1000 U/mL) treatment for 24 hours. h Western blot for total STAT3 and ADAR1 in the GX006 parental and GX006 5FU + CDDP resistant organoid lines stably transduced with non-target control (NTC) or STAT3 shRNA knockdown (clones 1 and 2) after treatment with vehicle control (CTRL) or 1000 U/mL interferon (IFN) for 24 hours. β-actin served as a loading control. Images representative of n = 3 independent experiments. (a) n = 2 independent experiments; (b) n = 3 independent experiments for GX006, GX005 and n = 5 independent experiments for GX060; (c, f, g, h) n = 3 independent experiments. Significance were calculated by (b) unpaired two-tailed student t-test; (c) one-sided extreme limiting dilution analysis. Data was presented as mean ± standard deviation. NES for normalized enrichment score, FDR for false discover rate. Source data are provided as a Source Data file.

