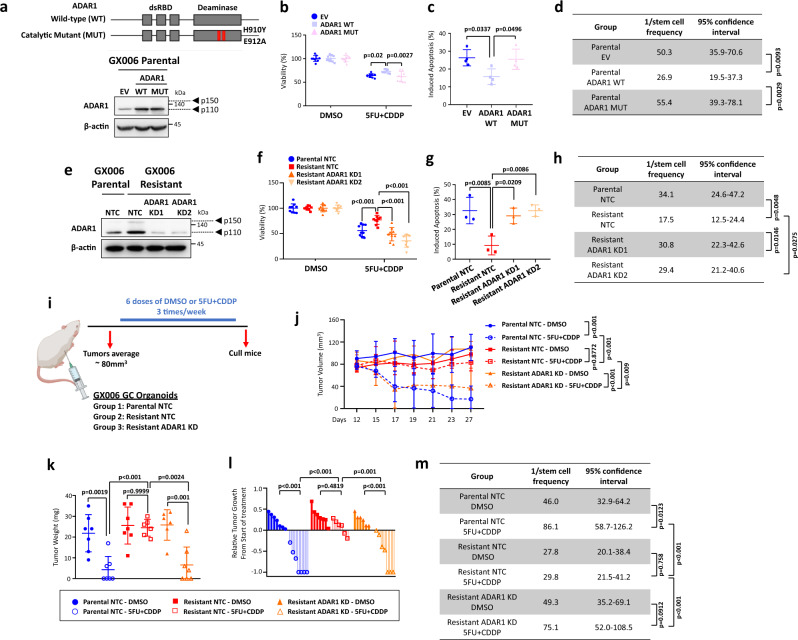
Fig. 2. ADAR1 promotes chemoresistance and self-renewal in 5FU + CDDP-resistant organoids.
a Schematic diagram of ADAR1 wild-type (WT) and catalytically-dead mutant (MUT) with point mutations in the deaminase domain illustrated. Western blot for ADAR1 in GX006 parental organoid lines stably transduced with empty vector (EV) control, ADAR1 WT or ADAR1 MUT. β-actin served as a loading control. b–d CellTiter-Glo analysis (b) and Annexin V-PI analysis (c) in the absence or presence of 1.25 µM 5FU + 5 µM CDDP, and in vitro limiting dilution spheroid formation and tumor-initiating cell frequency calculation (d) in GX006 parental organoid lines stably transduced with EV, ADAR1 WT or ADAR1 MUT. e Western blot for ADAR1 in GX006 parental and GX006 5FU + CDDP resistant organoid lines stably transduced with non-target control (NTC) or ADAR1 shRNA knockdown (clones 1 and 2). β-actin served as a loading control. f–h CellTiter-Glo analysis (f) and Annexin V-PI analysis (g) in the absence or presence of 5FU + CDDP, and in vitro limiting dilution spheroid formation and tumor-initiating cell frequency calculation (h) in GX006 parental and GX006 5FU + CDDP resistant organoid lines stably transduced with NTC or ADAR1 shRNA (clones 1 and 2). i Schematic diagram of treatment regimen comparing GX006 parental and resistant organoid lines stably transduced with NTC or ADAR1 shRNA (clones 1) injected into NSG mice subcutaneously. j, k Volume (j) and weight (k) of tumors derived from the indicated cell lines at end point. l Waterfall plot showing the response of each tumor in each group at end point. m Ex vivo limiting dilution assay of tumors harvested from each group to evaluate tumor-initiating cell frequency. (a, b, d, e, f, g, h) n = 3 independent experiments; (c) n = 4 independent experiments); (i–m), n = 6-7 mice. Significance were calculated by (b, f, j) two-way ANOVA; (c, g, k, l) by one-way ANOVA; (d, h, m) by one-sided extreme limiting dilution analysis. Data was presented as mean ± standard deviation. EV for empty vector control, WT for wild-type, MUT for catalytically-dead mutant, NTC for non-target control, ADAR1 KD1 and KD2 for shRNA knockdown (clones 1 and 2). ns for not significant. Source data are provided as a Source Data file. Illustration for (i) was created using BioRender.com.

