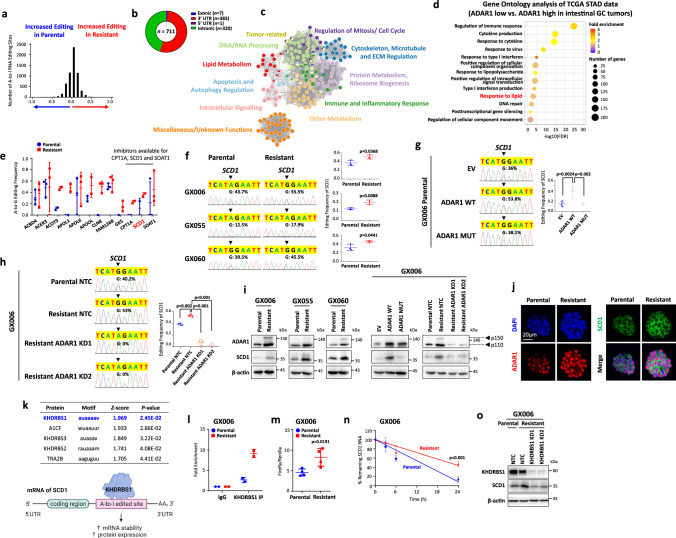
Fig. 3. ADAR1-mediated RNA editing of SCD1 promotes its expression.
a Distribution of putative A-to-I RNA editing sites (n = 6025). b-c Distribution of A-to-I RNA editing events hyper-edited in 5FU + CDDP resistant organoid lines as categorized by regions of the RNA transcript (b) and biological processes (c). d Gene ontology analysis of differentially regulated genes by comparing gastric cancer patients of intestinal subtype (TCGA-STAD) with high ADAR1 or low ADAR1 expression (stratified by median ADAR1 expression). e Putative hyper-edited genes involved in lipid metabolism from GX006, GX055 and GX060. n = 3 biologically independent samples. f-h Sequence chromatograms of the SCD1 transcript in the indicated cell groups. Dot plots represent editing levels of SCD1. i Western blot for ADAR1 and SCD1 expression in the indicated cell groups. β-actin served as a loading control. j Immunofluorescence images showing concomitant high expression of ADAR1 with SCD1. Scale bar, 20 µm. k Top 5 RNA binding proteins predicted to bind to SCD1 3’UTR A-to-I editing sites by RBPmap. Illustration of binding of KHDRBS1 on to SCD1 3’UTR and the potential effect of A-to-I editing on the binding sites on SCD1 RNA. l immunoprecipitation binding assay of KHDRBS1 in parental or resistant organoids (GX006). m Luciferase reporter assay with SCD1 3’UTR in parental or resistant organoids (GX006). n Stability of SCD1 RNA following Actinomycin D treatment (10 µg/mL) for 3, 6, or 24 hours. Lines were linear regression of the data. o Western blot for KHDRBS1 and SCD1 expression in GX006 parental and GX006 5FU + CDDP resistant organoid lines stably transfected with NTC or KHDRBS1 shRNA (clones 1 and 2). (f, h, i, j, o) n = 3 independent experiments; (g, m, n) n = 4 independent experiments; (l) n = 2 independent experiments. Significance were calculated by (e, f, l m) unpaired two-tailed student t-test; (g–h) one-way ANOVA; (n) two-way ANOVA. Data was presented as mean ± standard deviation. EV for empty vector control, WT for wild-type, MUT for catalytically-dead mutant, NTC for non-target control, ADAR1 KD1 and KD2 for shRNA knockdown (clones 1 and 2), KHDRBS1 KD1 and KD2 for shRNA knockdown (clone 1 and 2). Source data are provided as a Source Data file. Illustration for (k) was created using BioRender.com.

