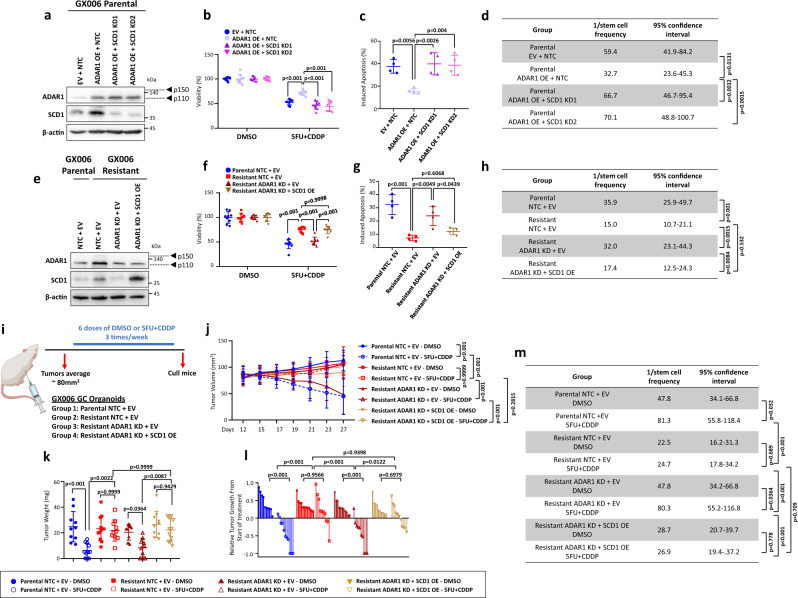
Fig. 4. ADAR1-mediated upregulation of SCD1 drives chemoresistance in gastric cancer.
a Western blot for ADAR1 and SCD1 expression in GX006 parental organoids with or without ADAR1 overexpressed and with or without SCD1 concomitantly repressed. b–d CellTiter-Glo analysis of cell viability (b), Annexin V-PI analysis of apoptotic cells (c) and in vitro limiting dilution spheroid formation and tumor-initiating cell frequency calculation (d) in GX006 parental organoid lines with or without ADAR1 overexpressed and with or without SCD1 concomitantly repressed. e Western blot for ADAR1 and SCD1 expression in GX006 parental and GX006 5FU + CDDP resistant organoid lines with or without ADAR1 repressed and with or without SCD1 concomitantly overexpressed. Images representative of n = 3 independent experiments. f–h CellTiter-Glo analysis of cell viability (f), Annexin V-PI analysis of apoptotic cells (g) and in vitro limiting dilution spheroid formation and tumor-initiating cell frequency calculation (h) GX006 parental and GX006 5FU + CDDP resistant organoid lines with or without ADAR1 repressed and with or without SCD1 concomitantly overexpressed. i Schematic diagram of treatment regimen comparing GX006 parental and GX006 5FU + CDDP resistant organoid lines with or without ADAR1 repressed and with or without SCD1 concomitantly overexpressed injected into NSG mice subcutaneously. j, k Volume (j) and weight (k) of tumors derived from the indicated cell lines at end point. l Waterfall plot showing the response of each tumor in each group at end point. m Ex vivo limiting dilution assay of tumors harvested from each group to evaluate tumor-initiating cell frequency. (a–h) n = 3 independent experiments; (i–m) n = 10–12 mice. Significance were calculated by (b, f, j) two-way ANOVA; (c, g, k, l) by one-way ANOVA; (d, h, m) by one-sided extreme limiting dilution analysis. Data was presented as mean ± standard deviation. EV for empty vector control, NTC for non-target control, OE for overexpression, SCD1 KD1 and KD2 for SCD1 shRNA knockdown (clones 1 and 2), ADAR1 KD for ADAR1 shRNA knockdown (clone 1). ns for not significant. Source data are provided as a Source Data file. Illustration for (i) was created using BioRender.com.

