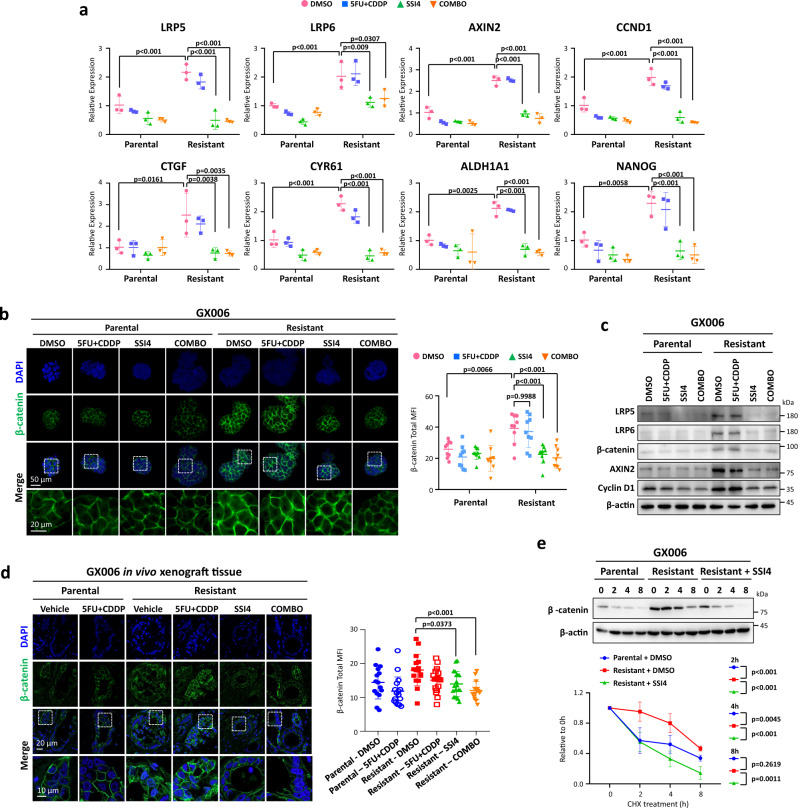
Fig. 7. SCD1 drives cancer stemness via augment Wnt/β-catenin signaling.
a qPCR analysis of LRP5, LRP6, AXIN2, CCND1, CTGF, CYR61, ALDH1A1 and NANOG in the indicated treatment groups in GX006 parental and GX006 5FU + CDDP resistant organoids. b Representative immunofluorescence images and quantification of β-catenin staining in the indicated treatment groups in GX006 parental and GX006 5FU + CDDP resistant organoids. Scale bar, 50μm (low magnification) and 20μm (high magnification). c Western blot analysis for expression of LRP5, LRP6, β-catenin, AXIN2, cyclin D1 in the indicated treatment groups in GX006 parental and GX006 5FU + CDDP resistant organoids. β-actin is used as the loading control. d Representative immunofluorescence images of GX006 parental and GX006 5FU + CDDP resistant xenografts stained with β-catenin. Scale bar, 20μm (low magnification) and 10μm (high magnification). e Western blot for β-catenin following cycloheximide (CHX) treatment for 0, 2, 4 and 8 hours in GX006 parental, GX006 5FU + CDDP resistant organoids and GX006 5FU + CDDP resistant organoids treated with SSI4. (a, c, e) n = 3 independent experiments; (b) n = 3 independent experiments. (d) n = 15–19 randomly captured field of view. Parental-DMSO and Resistant-COMBO, n = 15 images; Parental-5FU + CDDP and Resistant-DMSO, n = 17 images; Resistant-5FU + CDDP, n = 16 images; Resistant-SSI4 and, n = 19 images. Significance were calculated by (a, b) two-way ANOVA; (d, e) one-way ANOVA. All data were presented as mean ± standard deviation. COMBO for combination, MFI for mean fluorescence intensity. ns for not significant. Source data are provided as a Source Data file.

