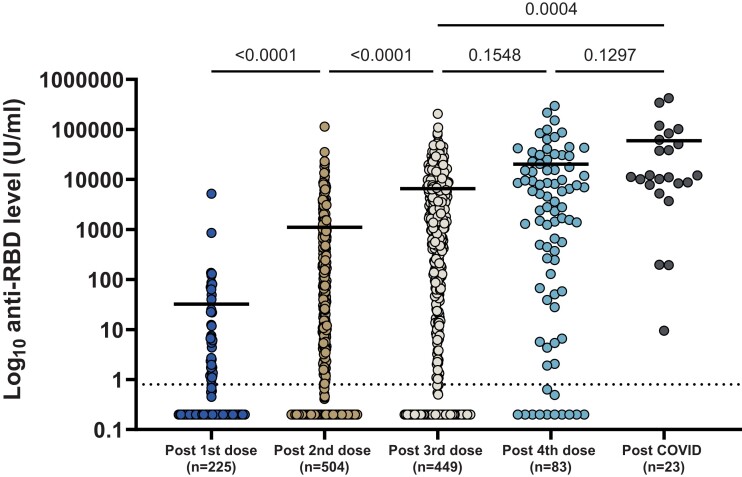
Figure 3.
Dot plot of anti-receptor binding domain (RBD) response after each vaccine dose. Horizontal line denotes median responses. Dotted line is the cutoff value for positivity of the assay (0.8 U/mL). Note that post-coronavirus disease (COVID) patients are not included in the postvaccination plots.

