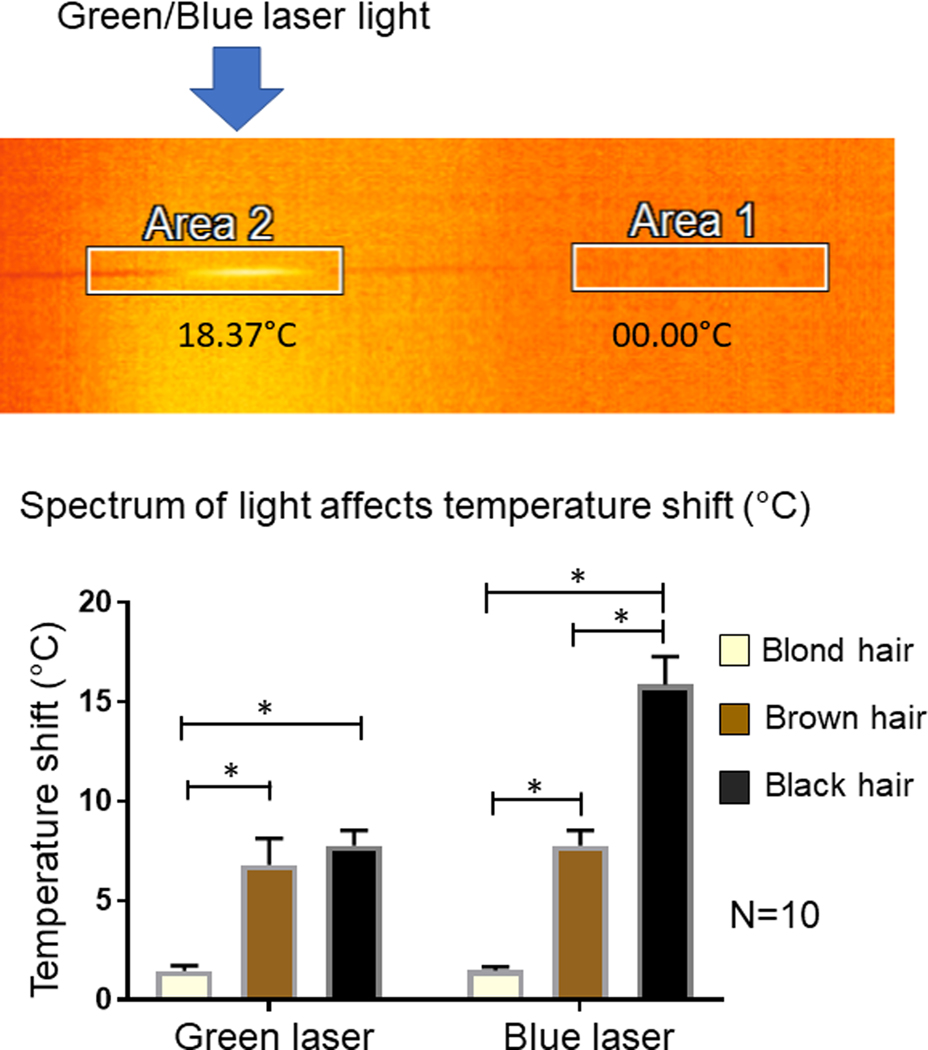
Figure 2.
Hair shaft temperature measurements. Upper panel: Representative example of hair shaft temperature image under IR Thermal Microscope. Area 2 in this example is illuminated with green or blue laser and its temperature recorded. Lower panel: The graph of a temperature shift of hair shaft of illuminated area under one minute of green or blue laser illumination. * asterisk represent the statistically significant difference.

