Fig. 1.
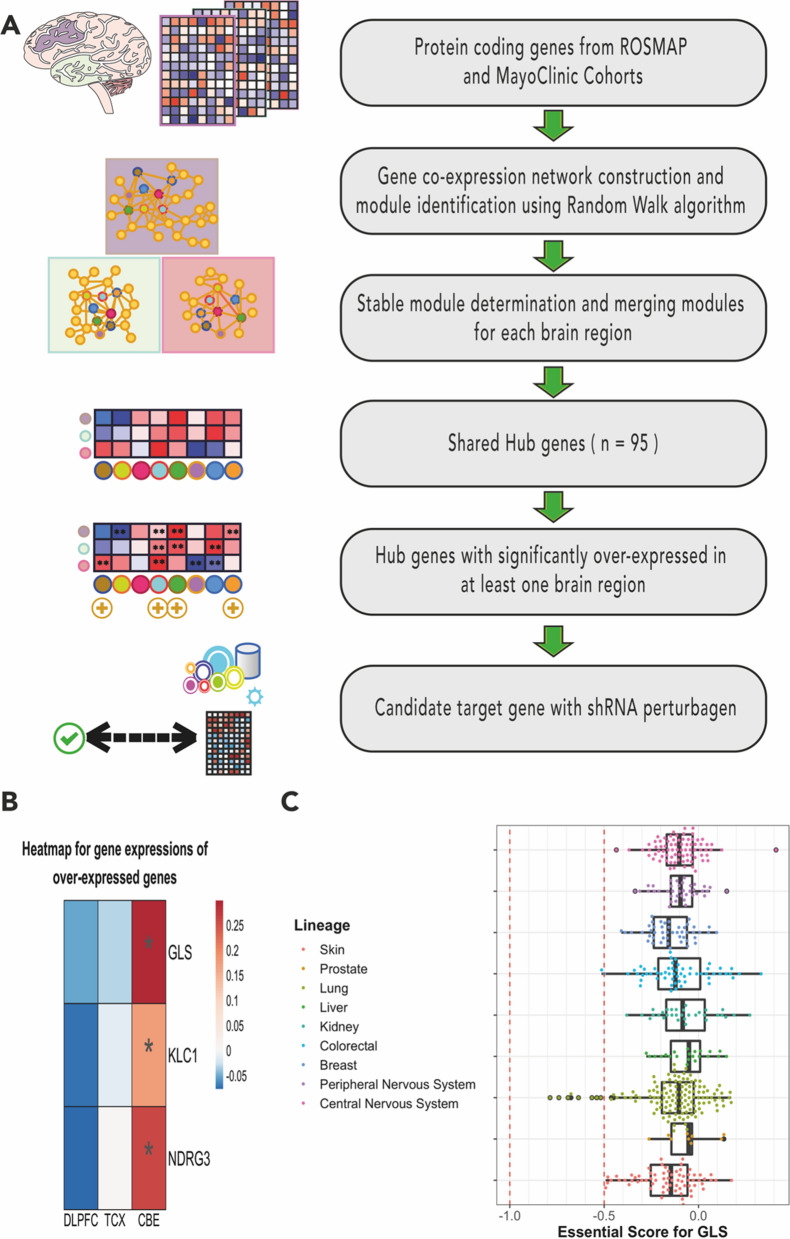
A The flowchart illustrating the identification of candidate target genes. To summarise, transcriptome data from Religious Orders Study/Memory and Ageing Project (ROSMAP) and MayoClinic cohorts sampled from the dorsolateral prefrontal cortex (purple in the illustration), temporal cortex (light green in the illustration) and cerebellum (light red in the illustration) of the AD patients and non-AD elders have been analysed by systems biology methods, including GCN. 95 shared and central co-expressed genes were in our interest. Hub genes overexpressed at least in one brain region in AD were used for further analysis. B Heatmap showing the log-twofold changes of GLS, KLC1 and NDRG1, which have been overexpressed either on the disease dorsolateral prefrontal cortex, temporal cortex or cerebellum. The blue-to-red colour transition indicates overexpression in AD samples. Significant differential expressions (adjusted p-value < 0.05) labelled with “*”. C Boxplot showing the GLS essentiality scores in nervous system cell lineages. Boxes represent the interquartile ranges where a median is a middle vertical line in a box

