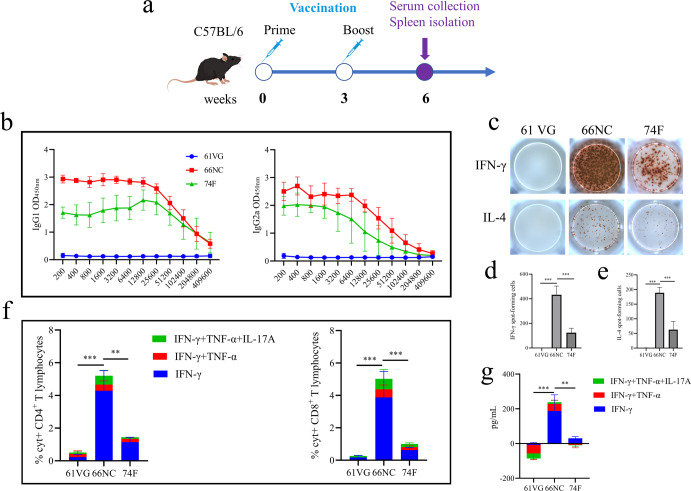
Fig. 3. Immune responses in C57BL/6 mice immunized with the 66NC fusion protein in Montanide ISA 61 VG adjuvant.
a Schematic diagram of the vaccination timeline. C57BL/6 mice were subcutaneously injected two times (three weeks apart) with 50 μg 66NC fusion protein formulated in Montanide ISA 61 VG adjuvant. Control groups include mice immunized with Montanide ISA 61 VG adjuvant alone as a negative control or 74 F mixed MPL adjuvant as subunit vaccine control. Three weeks after the booster immunization, the mice were bled and sacrificed. b Antigen-specific IgG1 and IgG2a isotypes were measured by ELISA. c Pictures of the IFN-γ and IL-4 ELISpot assay (representative of one experiment with at least five independent replicates). d, e Quantitation of the IFN-γ and IL-4 ELISpot assay. f The percentage of cytokine-positive (%Cyt+) antigen-specific T-lymphocytes was quantified by intracellular cytokine staining (ICS) in CD4+ and CD8+ following stimulation of splenic T lymphocytes with the indicated antigen. g Serum cytokines levels of IFN-γ, TNF-α, and IL-17A were measured by ELISA. d–g Error bars indicate the Standard Error of Mean (SEM). One-way ANOVA was used to analyze the statistical significance, followed by Tukey’s multiple comparisons tests. **P < 0.01, ***P < 0.001.

