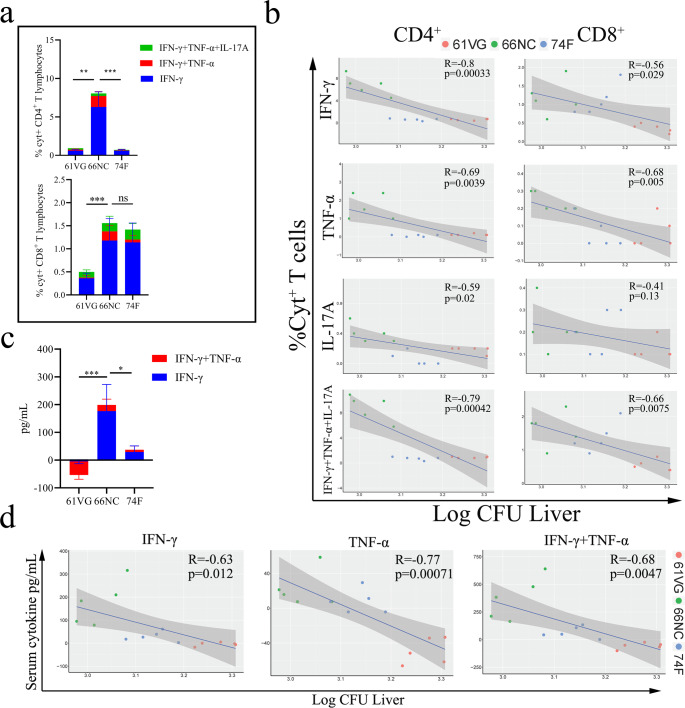
Fig. 7. Cellular immune responses post MAP challenge of vaccinated C57BL/6 mice.
a Percentage of cytokine-positive (Cyt+) splenic CD4+ and CD8 + T cells measured by intracellular cytokine staining two weeks post MAP challenge of mice vaccinated with the indicated antigen. b Pearson’s correlation (R) of Cyt+ CD4+ and CD8+ T lymphocytes with CFU in the liver following challenge. c Serum cytokine levels from Montanide ISA 61 VG (61 VG) adjuvant and vaccinated mice (66NC and 74 F) were assessed 2 weeks after being challenged by MAP K-10. d Pearson’s correlations of cytokine levels with CFU in the liver following challenge for IFN-γ and TNF-α. Data representative of one experiment with at least five independent replicates, mean ± SEM. One-way ANOVA was used to analyze the statistical significance, followed by Tukey’s multiple comparisons tests. ns, non-significant; *P < 0.05; **P < 0.01; ***P < 0.001.

