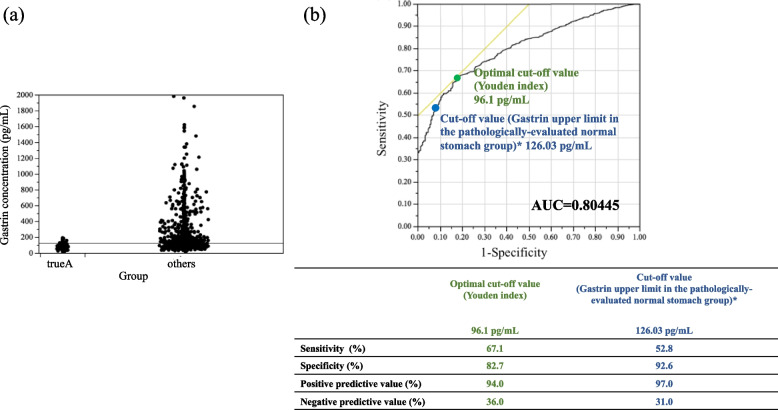
Fig. 2.
Validation of the diagnostic performance of the gastrin cut-off value in the endoscopically-evaluated group. a Comparative distribution of serum gastrin concentrations between the true A and “others” subgroups in the endoscopically-evaluated group. The horizontal line indicates the cut-off value, 126.03 pg/mL, which is the upper limit of the 95th percentile of the normal range of serum gastrin concentrations calculated in the pathologically-evaluated normal stomach group. b Receiver operating characteristic (ROC) curves with the cut-off value for detecting gastritis in the endoscopically-evaluated group. Area under the ROC curve = 0.80

